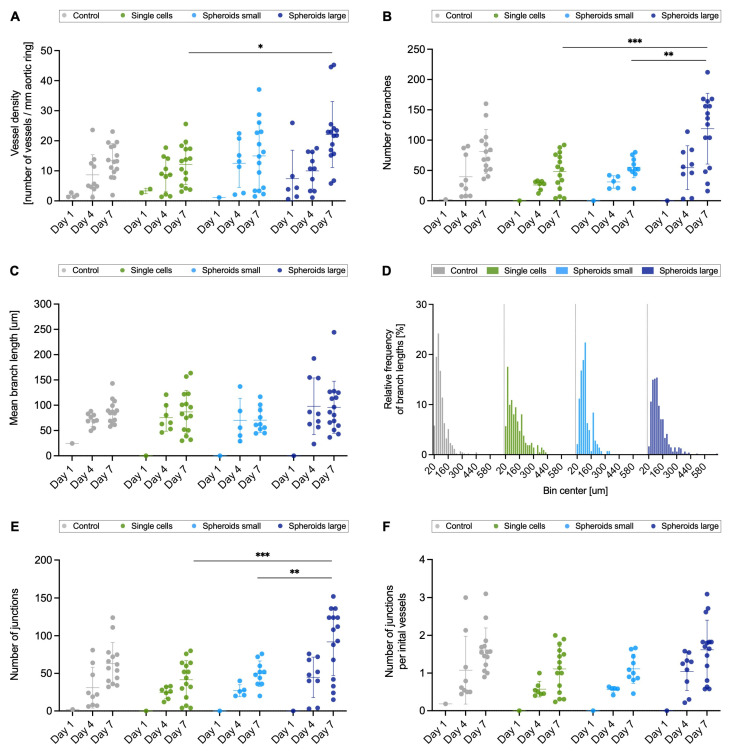
Figure 4.
Comparison of sprouting parameters. The sprouting was compared between the groups: control, single cells, spheroids small, and spheroids large, and for this purpose the parameters vessel density (A), number of branches (B), mean branch length (C), relative frequency of branch lengths (D), number of junctions (E), and number of junctions per initial vessels (F) were analyzed. Groups were compared using one-way ANOVA with Tukey’s multiple comparison tests (B,E,F) and the nonparametric Kruskal–Wallis test for the day 7 time point ((A,C); * p < 0.05; ** p < 0.01; *** p < 0.001).

