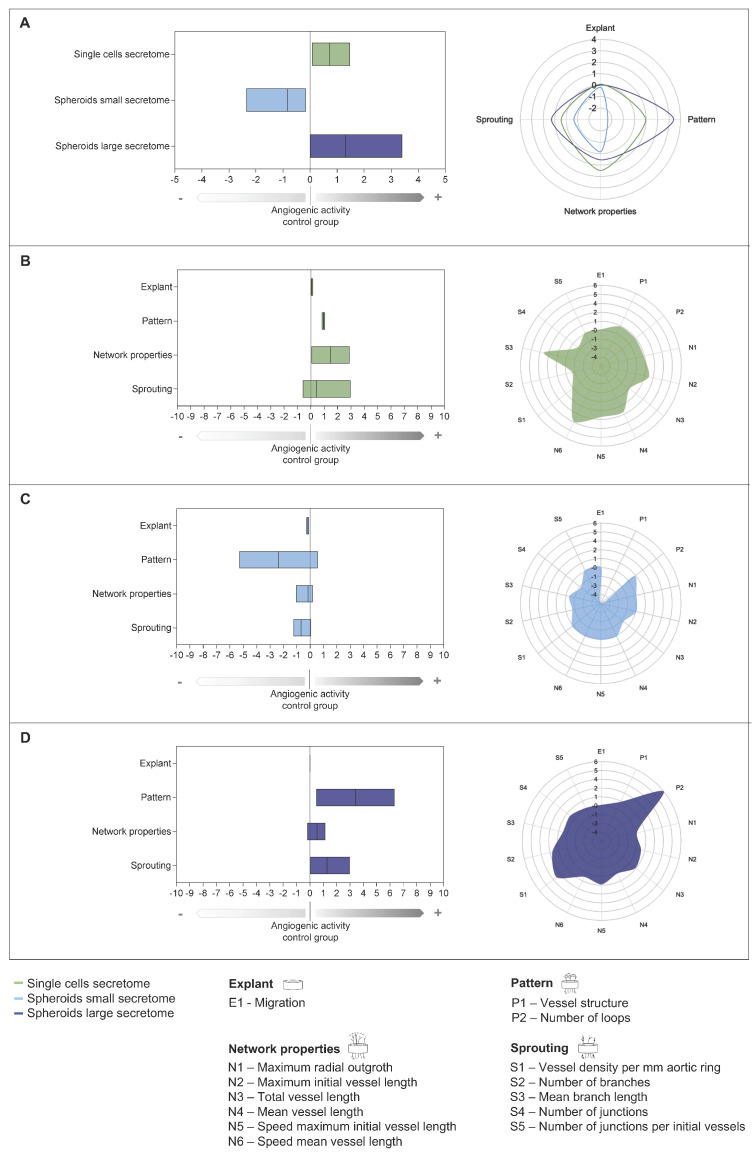
Figure 5.
Comprehensive characterization of secretome groups using angiogenic activity index (AAI) and angiogenic profile. The AAI for the secretome groups single cells, spheroid small and spheroid large (A), as well as for each group individually single cells (B); spheroid small (C); spheroid large (D) with the presentation of the subindex categories. Data are shown as boxplots with min to max values and mean. The value zero represents the angiogenic activity of the control group (serum-free medium) and values in the positive scale range indicate an increase in angiogenic activity compared with the control group, with a value of 1 representing an increase of 100%. The scale range with negative values shows a decrease or inhibition of angiogenic activity. The angiogenic profile is plotted in the chart and splits the values from the boxplot into the subindex categories (A). The individual parameters of the three examined secretome groups: single cells ((B), shown in green), spheroids small ((C), shown in light blue), and spheroids large ((D), shown in dark blue) are shown in the respective radar chart.

