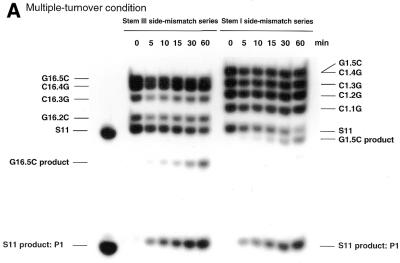
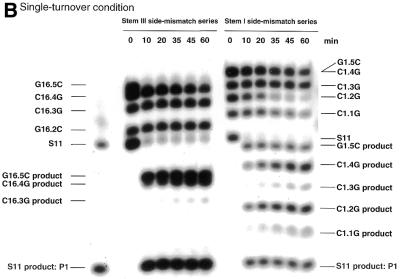
Figure 2.
Autoradiographs of polyacrylamide gels showing the cleavage of each variant of S11 as a function of time. (A) Multiple:turnover experiment: 1 nM R32, 50 mM Tris–HCl, 25 mM MgCl2 and 40 nM total substrate at 37°C and pH 8.0. (B) Single:turnover experiment: 30 nM R32, 50 mM Tris–HCl, 25 mM MgCl2 and 20 nM total substrate at 37°C and pH 8.0. We could not distinguish between bands C1.4G and G1.5C on the gel since they were very close to each other. We exposed these mismatched substrates to alkaline hydrolysis and enzymatic hydrolysis and confirmed the assignments (data not shown).


