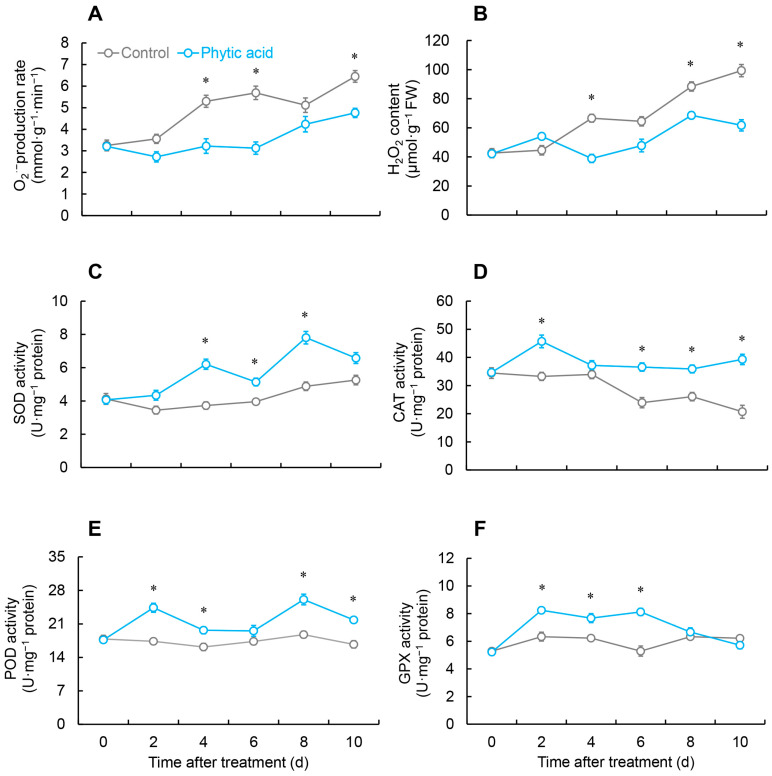
Figure 2.
Changes in O2•− production rate (A), H2O2 content (B), and the activities of SOD (C), CAT (D), POD (E), and GPX (F) in R. roxburghii fruit after phytic acid treatment during storage at room temperature. * denotes significant difference at the level of p < 0.05. Vertical bars represent the standard errors of the means (±SE).

