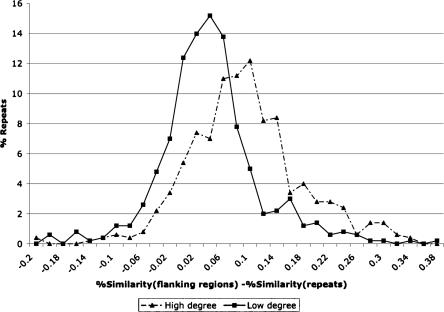
Figure 5.
Distribution of the difference statistic among columns with high and low degrees of incompatibility. The statistic measures the difference in sequence similarity between flanking and repeat regions. Repeats that show incompatibility to many other repeats may often be caused by insertion homoplasy. These repeats show larger values of the difference statistic.

