
Figure 5.
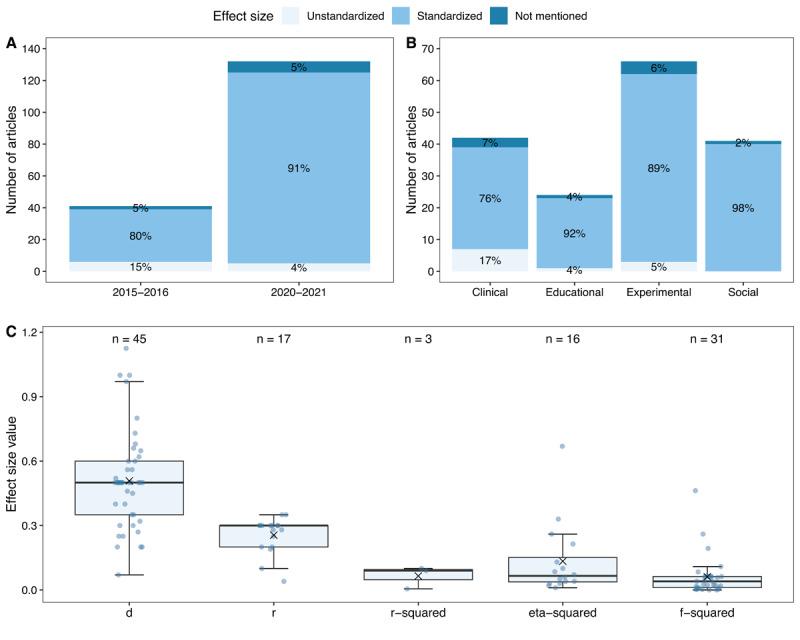
Standardized versus unstandardized effect sizes used in power analysis.
Note. Panel A and B are based on the 173 studies that report an a priori power analysis or sensitivity analysis. Panel C is based on the 112 articles that employed (and reported the type of) standardized effect in the power analysis and shows the values used for each type of standardized effect.8 The mean of the distribution is indicated by the cross.