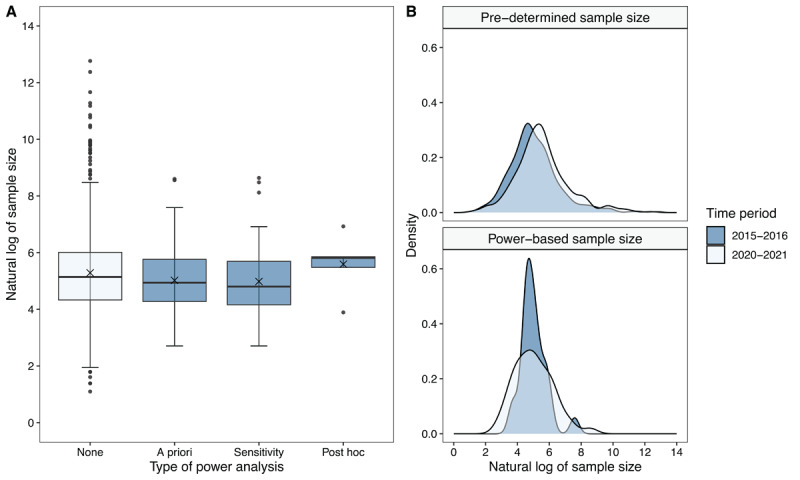
Figure 6.

Distribution of the (log-transformed) sample sizes A) per type of power analysis, aggregated across time periods, disciplines, and JIF quartiles (no power analysis, n = 725; a priori power analysis, n = 119;, sensitivity analysis, n = 54; post hoc power analysis, n = 5), and B) for articles where the sample size was either pre-determined (2015–2016, n = 428; 2020–2021, n = 356) or power analysis-based (2015–2016, n = 25; 2020–2021, n = 94) per time period.
