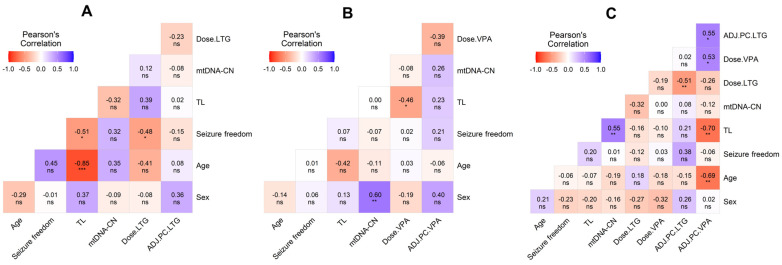
Figure 4.
Heatmap matrix depicting the multiple Pearson correlations between TL, mtDNA-CN, sex, age, and clinical variables with significant values. (A) Heatmap depicting the correlation in epilepsy patients on LTG. (B) Heatmap depicting the correlation in epilepsy patients on VPA. (C) Heatmap depicting the correlation in epilepsy patients on LTG + VPA. Significance is denoted by asterisks as follows: * p < 0.05, ** p < 0.01., and *** p < 0.001. ADJ.PC: adjusted plasma concentration of antiseizure drug.

