. 2025 Jan 6;8(1):8. doi: 10.5334/joc.414

Figure 2.

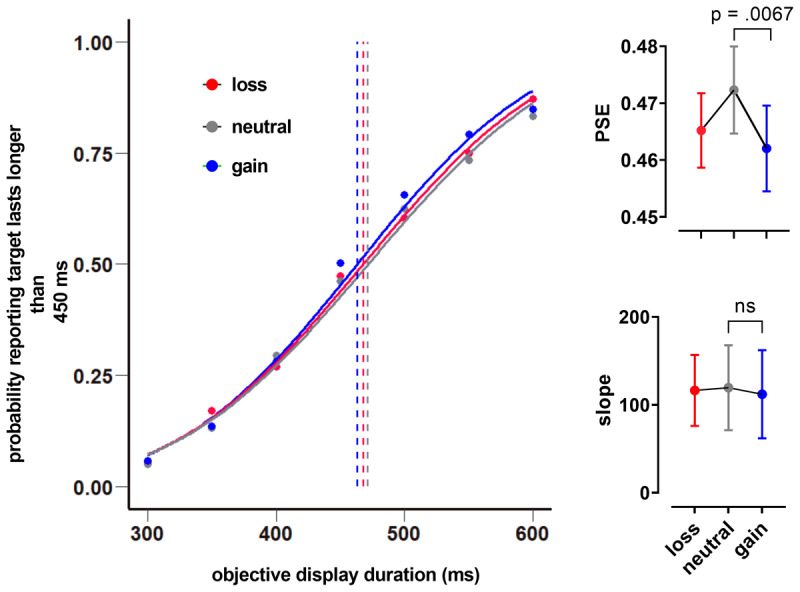
Result of reward influence on time perception. Probability of responses in which participants reported that the target duration lasted longer than the reference (450 ms) plotted as a function of the display duration for each reward condition, separately (gain, neutral, and loss). The points of subjective equality (PSE) are shifted to the left in the gain and loss conditions compared to the neutral condition. The PSE for reward conditions shows a significant difference between gain and neutral (top right). The slope values of the fitted psychometric function show a non-significant difference between gain and neutral (bottom right). (Note: bar graphs show mean and standard error)

Result of reward influence on time perception. Probability of responses in which participants reported that the target duration lasted longer than the reference (450 ms) plotted as a function of the display duration for each reward condition, separately (gain, neutral, and loss). The points of subjective equality (PSE) are shifted to the left in the gain and loss conditions compared to the neutral condition. The PSE for reward conditions shows a significant difference between gain and neutral (top right). The slope values of the fitted psychometric function show a non-significant difference between gain and neutral (bottom right). (Note: bar graphs show mean and standard error).