. 2025 Jan 6;8(1):8. doi: 10.5334/joc.414

Figure 3.

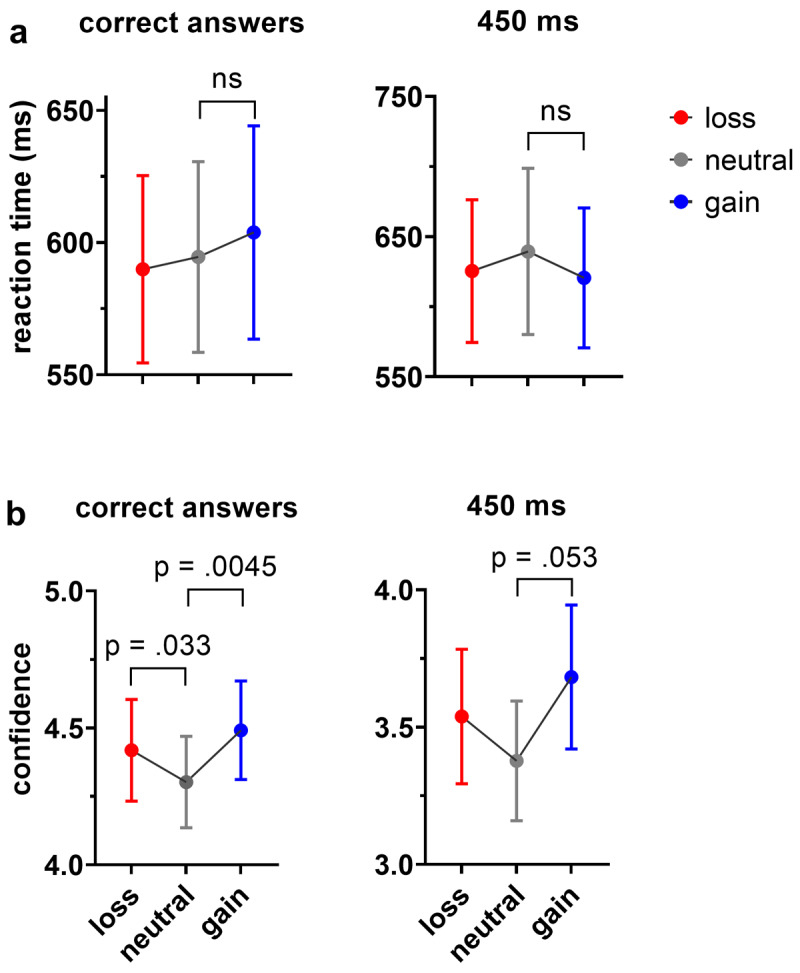
Reward influence on reaction time and confidence. (a) Mean values of reaction time across all probe durations, except for 450 ms, are shown on the left, while mean values of reaction time perceived as longer for 450 ms are shown on the right. (b) Mean confidence scores for all probe durations, except for 450 ms, are depicted on the left, and mean values of confidence ratings perceived as longer only for 450 ms are presented on the right. (The 450 ms is plotted separately since it is equal to the reference duration and no correct response is given for this duration)

Reward influence on reaction time and confidence. (a) Mean values of reaction time across all probe durations, except for 450 ms, are shown on the left, while mean values of reaction time perceived as longer for 450 ms are shown on the right. (b) Mean confidence scores for all probe durations, except for 450 ms, are depicted on the left, and mean values of confidence ratings perceived as longer only for 450 ms are presented on the right. (The 450 ms is plotted separately since it is equal to the reference duration and no correct response is given for this duration).