. 2025 Jan 6;8(1):8. doi: 10.5334/joc.414

Figure 6.

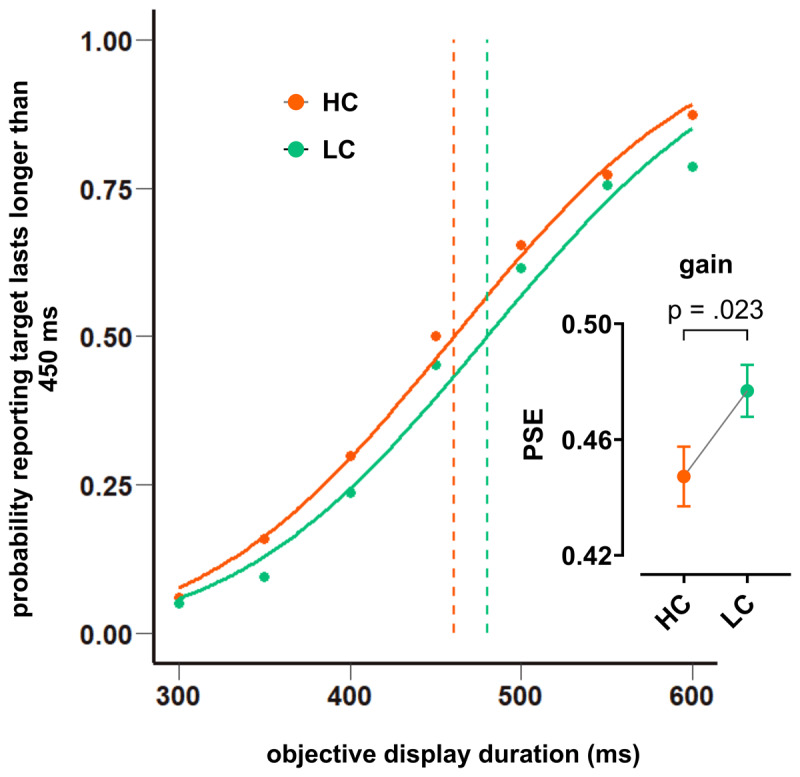
Effect of reward gain on time perception between HC and LC groups. Comparison of PSEs between the HC and LC groups in the gain condition are plotted with corresponding psychometric functions. The PSE is shifted to the left in the HC compared to LC group. The comparison of the means of PSEs between the HC and LC groups indicates significant difference in between groups. (Note: bar graph is plotted based on the mean and standard error)

Effect of reward gain on time perception between HC and LC groups. Comparison of PSEs between the HC and LC groups in the gain condition are plotted with corresponding psychometric functions. The PSE is shifted to the left in the HC compared to LC group. The comparison of the means of PSEs between the HC and LC groups indicates significant difference in between groups. (Note: bar graph is plotted based on the mean and standard error).