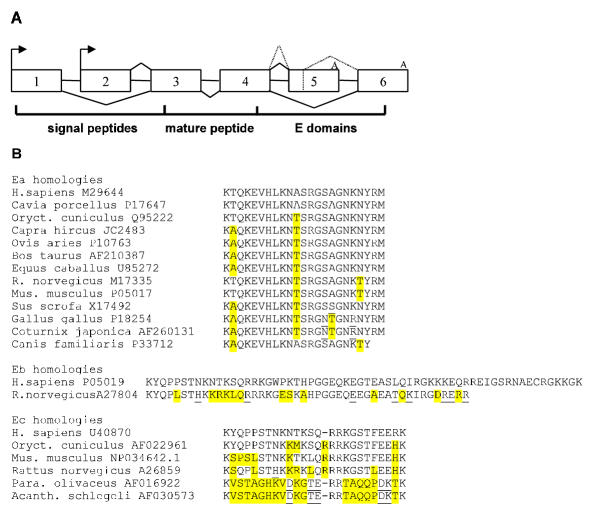
Figure 1.
(A) Alternative splicing of the human IGF-I gene. Exons are shown as boxes, introns as lines, transcription start sites as arrows, splicing patterns as sloped lines, and polyadenylation signals as the letter A. The protein coding potential of the exons is indicated underneath. (B) Alignment of predicted alternative E domains. Species are given on the left; non-homologous residues are highlighted in yellow; similarities are underlined.

