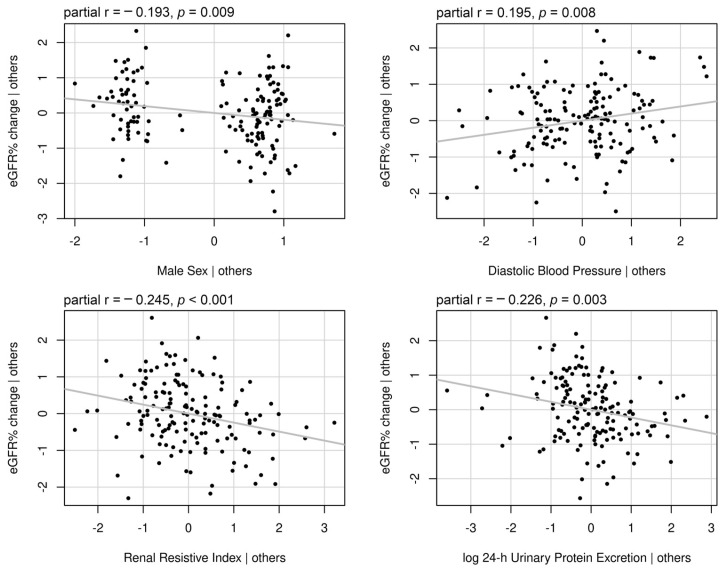
Figure 3.
Partial regression plots of standardized variables independently associated with eGFR% change. The plots illustrate the relationships between individual predictor variables and the response variable while controlling for the effects of other predictors. The slope of the regression lines represents the partial correlation coefficient reported with the p-value on each plot.

