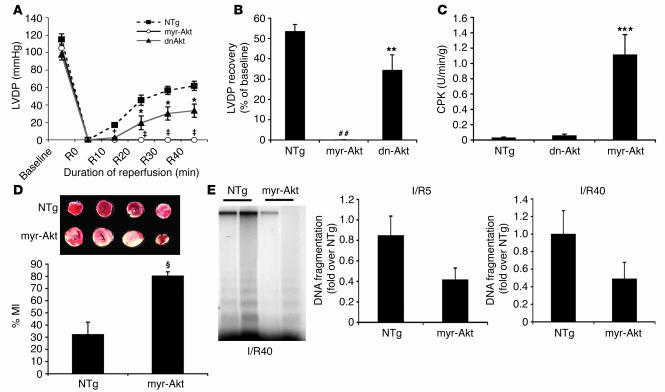
Figure 1.
Chronic Akt activation in myr-Akt–Tg mice has detrimental effects on cardiac functional recovery and injury after ischemia/reperfusion. (A) LVDP profiles during ischemia/reperfusion in NTg (filled squares; n = 11), myr-Akt (open circles; n = 11), and dn-Akt mice (filled triangles; n = 5). †P < 0.01 and ‡P < 0.001, myr-Akt versus NTg; *P < 0.001, dn-Akt versus NTg. (B) Maximum LVDP recovery (percent of baseline) measured at 40 minutes of reperfusion. ##P < 0.0001 versus NTg; **P < 0.02 versus NTg. (C) CPK values in the effluent collected during reperfusion period (NTg, n = 6; dn-Akt, n = 4; myr-Akt, n = 7). ***P < 0.02 versus dn-Akt. (D) Micrograph showing representative TTC staining of cardiac sections from NTg (top row) and myr-Akt (bottom row) mice. Effects on quantitated cumulative infarct area size in myr-Akt compared with NTg mice (n = 3 each) are represented in the bar graph. §P < 0.005 versus NTg. %MI, myocardial infarct area/ventricular area. (E) Representative DNA laddering indicating the degree of apoptosis in perfused heart tissues from myr-Akt and NTg mice (n = 3 each) after 20 minutes ischemia/40 minutes reperfusion (I/R40). Bar graphs depict quantitation of DNA ladder density and represent results of 3 independent experiments after 20 minutes of ischemia and either 5 (I/R5) or 40 minutes of reperfusion.

