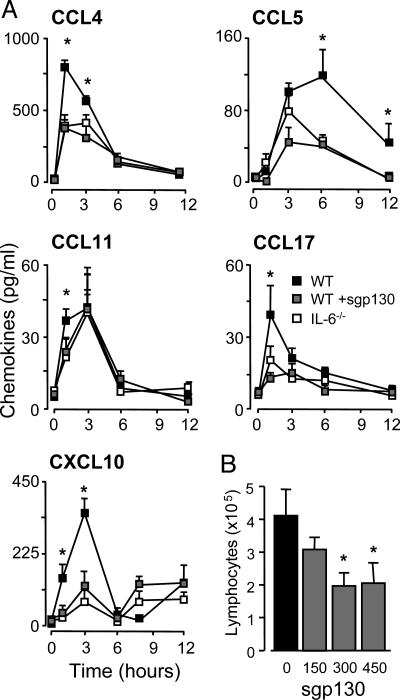
Fig. 3.
Peritoneal chemokine levels after SES-induced inflammation. (A) SES-induced peritoneal inflammation was established in WT and IL-6-/- mice, and at defined intervals, the peritoneal cavity was lavaged and chemokine levels quantified by ELISA. To block IL-6 trans-signaling, WT mice were administered with 150 ng per mouse sgp130. (B) Dose-dependent blockade of SES-induced lymphocyte recruitment (48 h) by sgp130 administration of WT mice. Values represent the mean ± SEM (n = 5 mice per group; *, P < 0.05).

