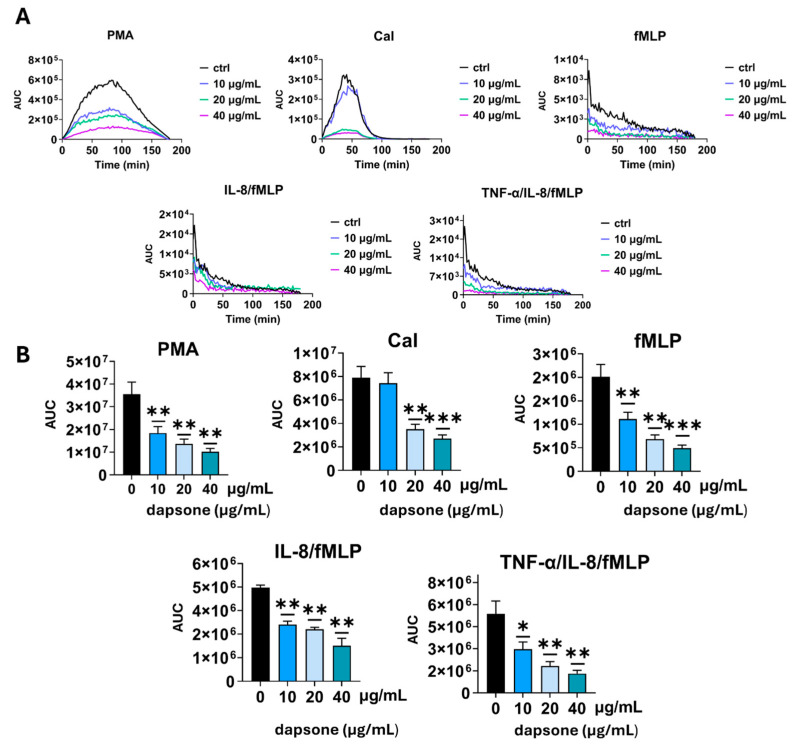
Figure 3.
Effect of dapsone on ROS production (A,B). Neutrophils were cultured alone or with dapsone as described in the Materials and Methods section. ROS production was evaluated by measuring luminescence intensity in real time. The values are shown as the area under the curve (AUC). (A) A representative histogram showing real-time ROS production. (B) Summarized results are presented as mean ± SD from 4 independent experiments carried out with different donors. * p < 0.05; ** p < 0.01 and *** p < 0.001 compared with corresponding control (dapsone-untreated) groups.

