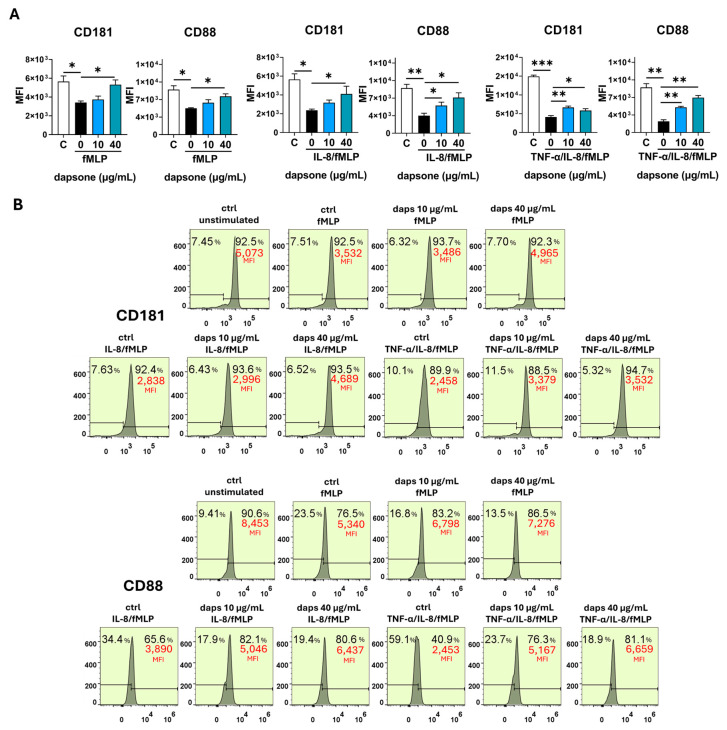
Figure 9.
Effect of dapsone on the neutrophil phenotype. After incubation with dapsone (10 μg/mL and 40 μg/mL), neutrophils were activated with fMLP or primed with cytokines and then subsequently stimulated with fMLP. (A) The expressions of CD181 and CD88 are represented as mean fluorescence intensity (MFI) (mean ± SD from 3 independent experiments). (B) The representative histograms from one experiment. * p < 0.05, ** p < 0.01, and *** p < 0.001 compared with corresponding controls as indicated. C = control, unstimulated neutrophils.

