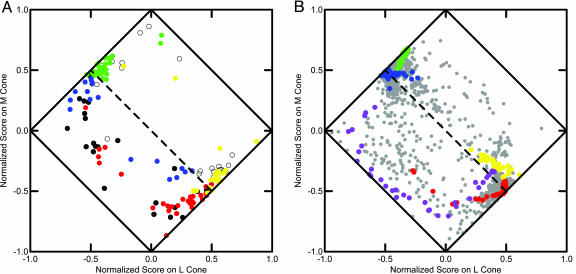
Fig. 2.
Plots of scaled locations of LGN spectra and Munsell spectra. (A) Mean spectra of 147 LGN cells represented in normalized cone coefficient space distinguished by type (red, +R-G; yellow, +Y-B; green, +G-R; blue, +B-Y; black +Bl-W; unfilled circle, +W-Bl). (B) Mean spectra of 1,269 Munsell color chips represented in normalized cone coefficient space distinguished by hue (blue, 5 Blue-Green; red, 5 Red; yellow, 10 Yellow; purple, 10 Purple-Blue; gray, remaining chips). Dashed line indicates where L + M = 0.

