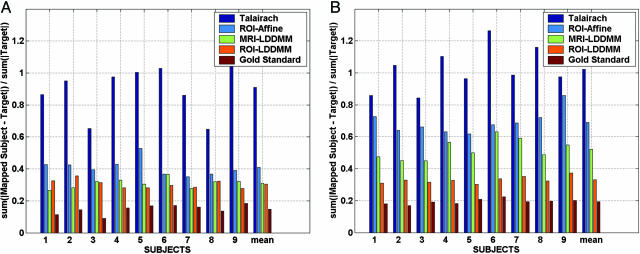
Fig. 5.
L1 error rate percentages of multiple subject hippocampi (A) and temporopolar cortices (B) for different registration methods. Error rates shown are L1 errors interpolated as fractions between 0 and 1 and normalized by target volume. Error rates are ordered according to the Talairach alignment (highest dark blue), the ROI-Affine mapping (light blue), the MRI-LDDMM segmentation (green), and the rough segmentation based ROI-LDDMM (orange). As a gold standard comparison (baseline), the lowest error bars result from using the gold standard segmentation (which is never available) as the true registration function for the LDDMM.

