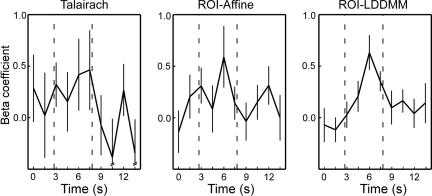
Fig. 7.
Plotted are the hemodynamic responses (as represented by the set of beta coefficients calculated by multiple regression in a deconvolution-style analysis) for the single voxel within the right perirhinal cortex that had the strongest (highest t value) signal for each technique. The three selected voxels were within several millimeters of each other.

