Figure 1.
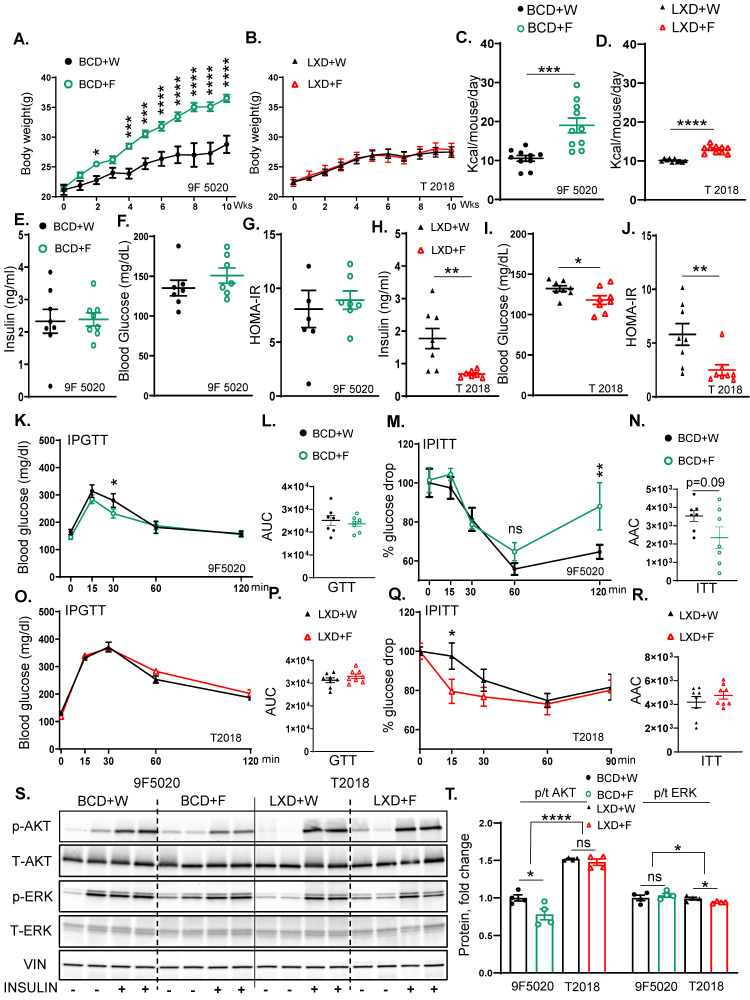
The baseline diet modifies the impact of fructose on weight gain and insulin resistance. (A) Weight gain of male mice on Boston chow diet (9F5020) supplemented with either regular water (BCD + W) or 30% fructose-sweetened water (BCD + F) for 10 weeks (n = 8 mice per group). (B) Weight gain of male mice on Lexington chow diet (T2018) supplemented with either regular water (LXD + W) or 30% fructose-sweetened water (LXD + F) for 10 weeks (n = 8 mice per group). (C) Average total caloric intake in mice on BCD (D) and LXD. (E) Fasting insulin levels, (F) blood glucose concentrations, and (G) Homeostatic Model Assessment for Insulin Resistance (HOMA-IR) for BCD-fed mice at 8 weeks on diet. (H) Fasting insulin levels, (I) blood glucose concentrations, and (J) HOMA-IR for LXD-fed mice at 8 weeks on the diet. (K) Glucose tolerance test (GTT) for BCD-fed mice performed after 8 weeks and (L) area under the curve (AUC) analysis for GTT results in BCD-fed mice. (M) Insulin tolerance test (ITT) in BCD-fed mice at 8 weeks, and (N) area above the curve (AAC) for ITT in BCD-fed mice. (O) GTT results for LXD-fed mice at 8 weeks and (P) AUC analysis for GTT. (Q) ITT in LXD-fed mice at 8 weeks on the diet and (R) AAC for ITT in LXD-fed mice. (S) Western blot analysis of phosphorylated and total AKT and ERK proteins in BCD and LXD-fed mice (n = 4 mice/group) and (T) Image J quantification of Western blot results for phosphorylated and total AKT and ERK proteins. Statistical comparisons were conducted using Student’s t-test for pairwise comparisons between the control and fructose groups. For analyses involving multiple groups, i.e., diet and fructose, two-way ANOVA followed by Tukey’s post hoc test was performed. Statistical significance is indicated by asterisks (*) when comparing fructose-supplemented groups to their respective controls: * p < 0.05; ** p < 0.01; *** p < 0.001; **** p < 0.0001; ns = not significant. Data are presented as mean ± SEM.

