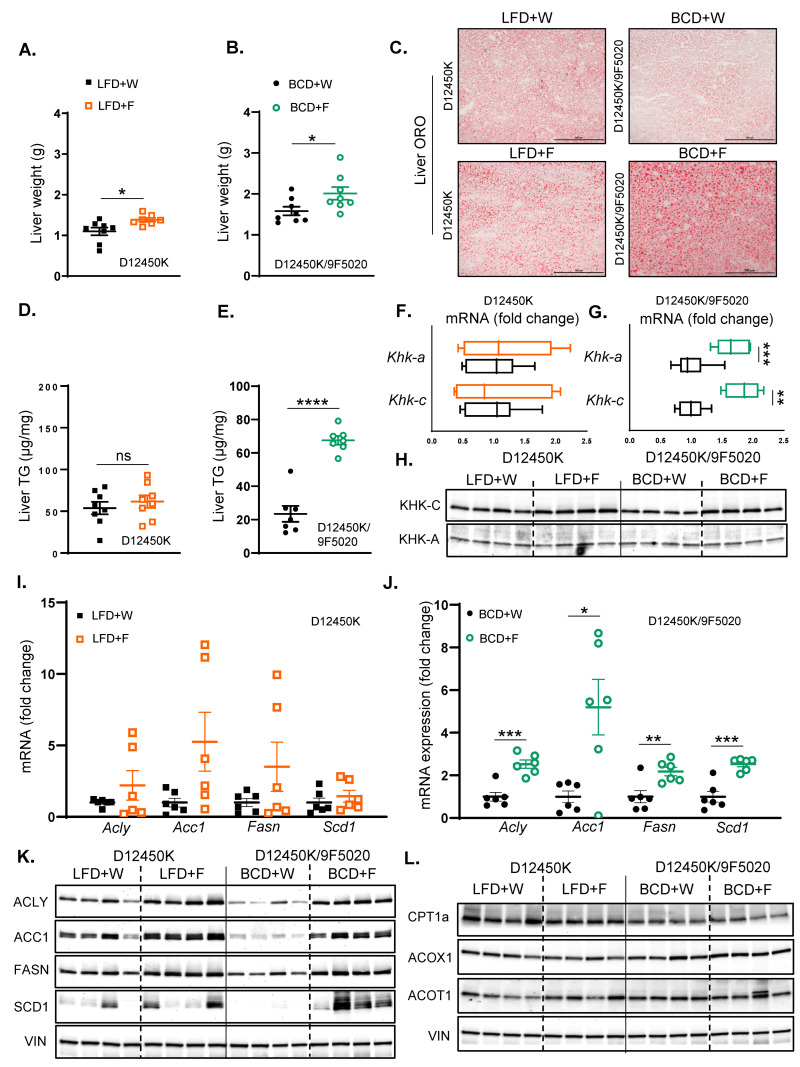
Figure 4.
Fructose enhances hepatic steatosis more strongly in mice on BCD than on LFD. (A) Liver weights of LFD-fed mice at sacrifice after 10 weeks on the diet. (B) Liver weights of BCD-fed mice at sacrifice after 20 weeks on the diet. (C) Oil Red O staining of liver sections from LFD- and BCD-fed mice, highlighting hepatic lipid accumulation. (D) Hepatic triglyceride (TG) content in LFD-fed (E) and BCD-fed mice. (F) mRNA expression of KHK isoforms in the liver of LFD-fed (G) and BCD-fed mice. (H) Protein levels of KHK isoforms in the liver of LFD- and BCD-fed mice. (I) mRNA expression of enzymes involved in hepatic fatty acid synthesis in LFD-fed (J) and BCD-fed mice. n = 6 mice per group. (K) Protein levels of enzymes involved in hepatic fatty acid synthesis in the liver of LFD and BCD-fed mice. (L) Protein levels of enzymes involved in hepatic fatty acid oxidation in LFD and BCD-fed mice (n = 4 mice/group). Statistical comparisons were conducted using Student’s t-test for pairwise comparisons between the control and fructose groups. Statistical significance is indicated by asterisks (*) when comparing fructose-supplemented groups to their respective controls: * p < 0.05; ** p < 0.01; *** p < 0.001; **** p < 0.0001; ns = not significant. Data are presented as mean ± SEM.

