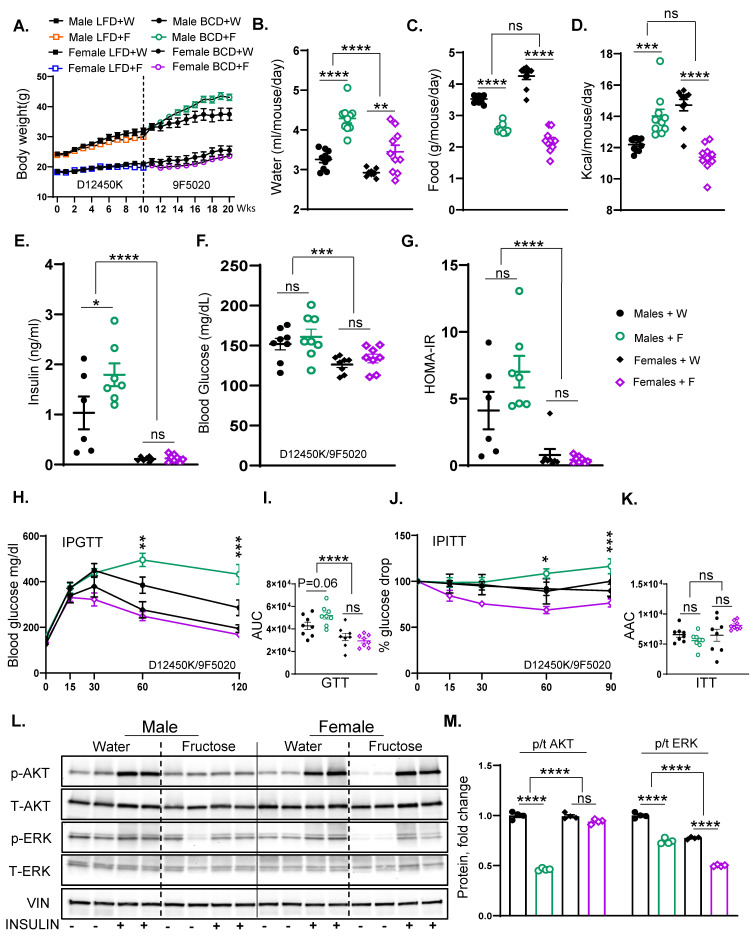
Figure 5.
Fructose supplementation results in weight gain and insulin resistance in male but not female mice. (A) Weight gain in male and female mice on LFD for 10 weeks who were then switched over to BCD for another 10 weeks and supplemented with either regular water or 30% fructose-sweetened water (n = 16 mice/group for first 10 weeks and n = 8 mice/group for the next 10 weeks). (B) Water consumption, (C) food consumption, and (D) total calorie intake of male and female mice from weeks 11 to 20 on the diets. (E) Fasting insulin levels, (F) blood glucose concentrations, and (G) HOMA-IR in male and female mice after 20 weeks on the diet. (H) Glucose tolerance test (GTT) results (I) and area under the curve (AUC) analysis for male and female mice, performed after 18 weeks on the diet. (J) Insulin tolerance test (ITT) and (K) area above the curve (AAC) analysis for male and female mice, performed after 18 weeks on the diet. (L) Western blot analysis (WB) of phosphorylated and total AKT and ERK proteins in liver tissues of male and female mice, respectively, and (M) Image J quantification showing protein levels of phosphorylated and total AKT and ERK (n = 4 mice/group). Statistical analysis was performed using two-way ANOVA followed by Tukey’s post hoc test for comparisons across multiple groups. Statistical significance, denoted by asterisks (*), represents comparisons of fructose-supplemented groups to their respective controls, as follows: * p < 0.05; ** p < 0.01; *** p < 0.001; **** p < 0.0001; ns = not significant. All data are expressed as mean ± SEM.

