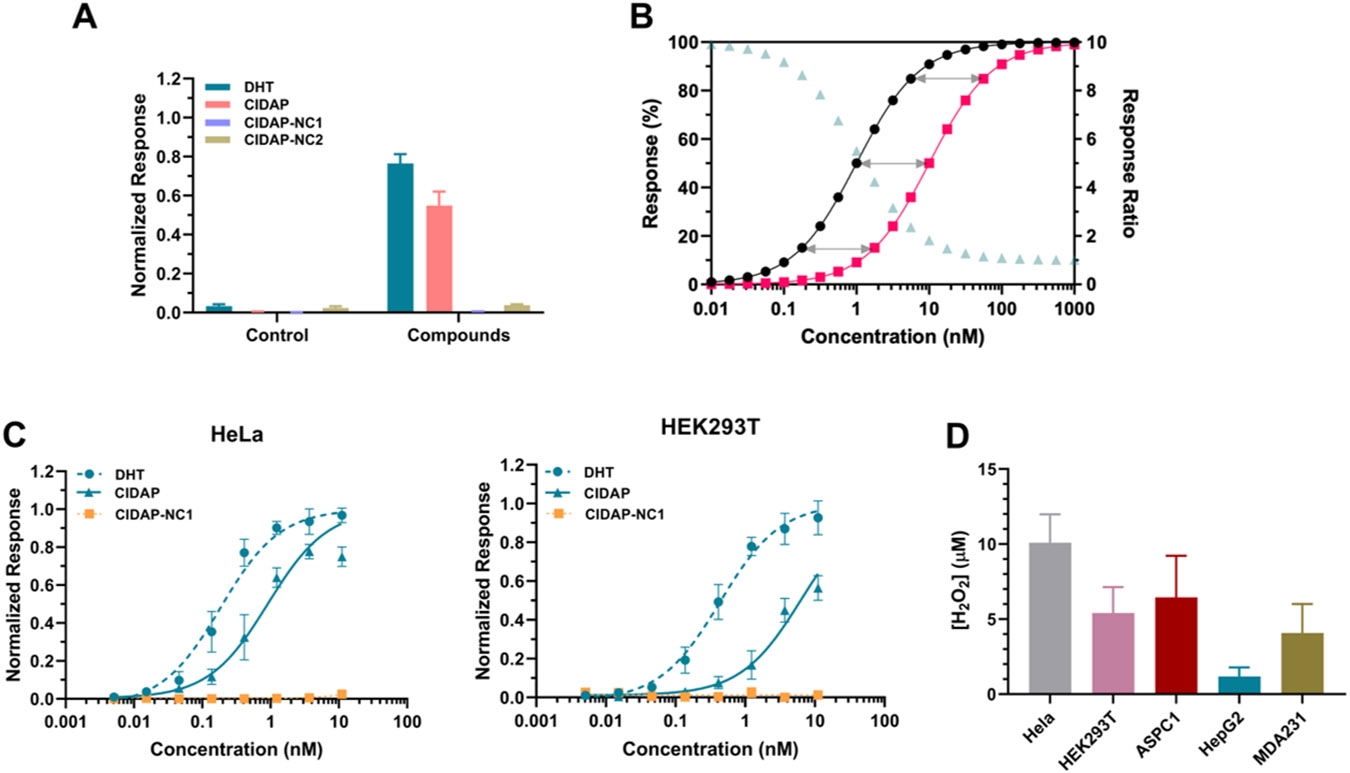
Figure 2.

Refinement and assessment of CIDAP system as a quantifying method for cellular peroxide level. (A) The bioluminescence response of DHT, CIDAP, CIDAP-NC1 and CIDAP-NC2. AR-LgBit and AR-SmBit are co-expressed in HeLa cells for 24 h, followed by the incubation with control (ethanol) and each compound at 1.1 nM, separately. The readouts were obtained after 2 h of incubation. Data are mean ± SEM of experimental replicates (n = 4). (B) Simulated Data for DHT and Probe responses. Black trace: DHT response; red trace: Probe response; pale green trace: the ratio of DHT and Probe responses at the same concentrations. (C) The dose-response curves of DHT, CIDAP, and CIDAP-NC1 in HeLa and HEK293T cells. Data are mean ± SEM of experimental replicates (n = 4). Both cell lines were incubated with different concentrations of DHT, CIDAP and CIDAP-NC1 (from 11 nM to 5 pM with 3-fold dilutions) for 2 h. Bioluminescence was measured in the presence of furimazine. (D) H2O2 levels in different cell lines. The SEM on the H2O2 level calculated using the global fitting program provided by GraphPad Prism (see Supporting Information for details).
