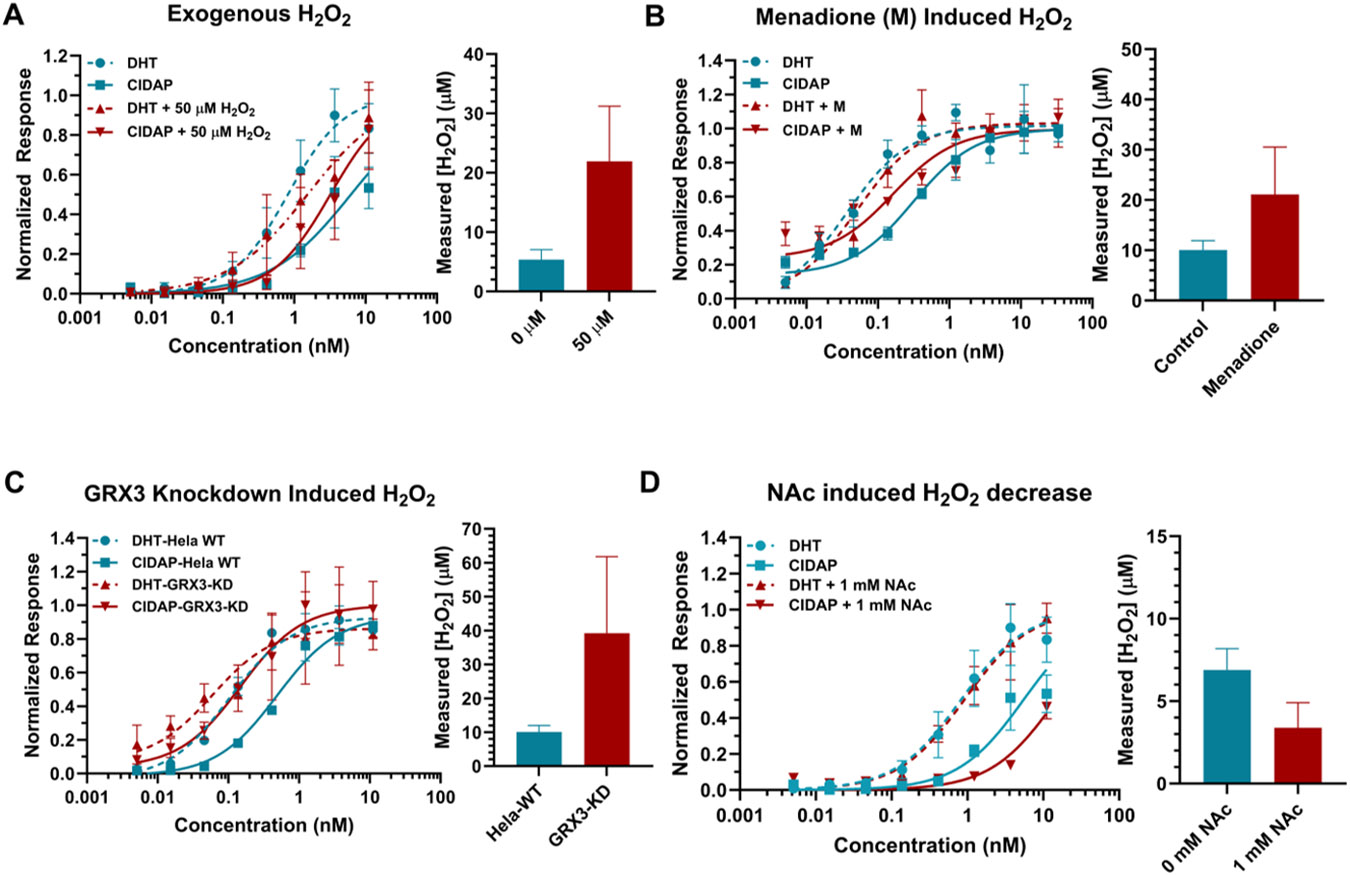
Figure 3.

Quantification of H2O2 levels in cells under various conditions. The response of CIDAP is accurately reflecting the fluctuation of cellular peroxide level. (A) H2O2 levels in HEK293T cells upon exogenous 50 μM H2O2 treatment. Data on the left are mean ± SEM of experimental replicates (n = 4). (B) H2O2 levels in HeLa cells pretreated with 10 μM menadione. Data on the left are mean ± SEM of experimental replicates (n = 4). (C) H2O2 levels in HeLa wild type and Grx-3 knockdown cell. Data on the left are mean ± SEM of experimental replicates (n = 3). (D) H2O2 levels in 293 cells pretreated with 1 mM NAc. The H2O2 level was measured after 1 hour of incubation with DHT/CIDAP. Data on the left are mean ± SEM of experimental replicates (n = 3). The SEM on the H2O2 level in (A) – (D) were calculated using the global fitting program provided by GraphPad Prism.
