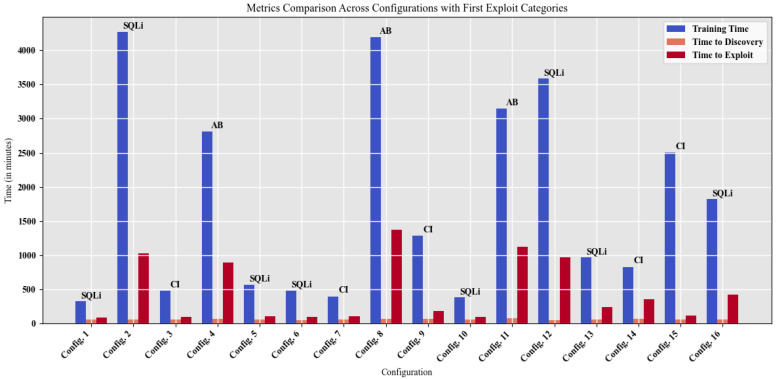
Figure 12.
Evolution of the metrics training time, time to discovery, and time to exploit across 16 configurations for two RL simulations. The figure shows how each metric evolves across the configurations, with different colors representing the individual metrics. Additionally, the figure includes the corresponding “First Exploit” categories, highlighting the different attack methods used.

