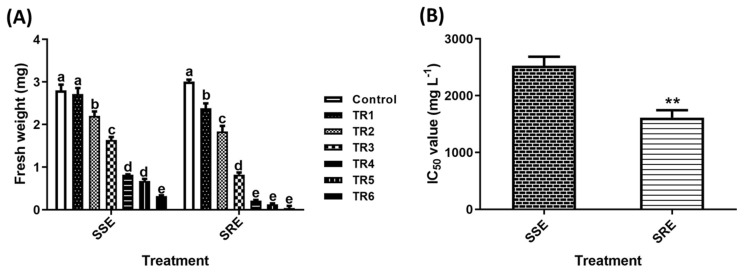
Figure 1.
(A) Screening of the effects of SSE and SRE extracts on T. repens seedlings. (B) IC50 values of SSE and SRE extracts. The bars represent the mean ± standard deviation (SD) (n = 3). Significant differences among treatments are indicated by different letters (a–e) based on Duncan’s multiple range test (DMRT, p < 0.05). The IC50 value for each treatment was calculated based on the fresh weight of T. repens seedlings. Statistical significance was determined using a t-test (** p < 0.01).

