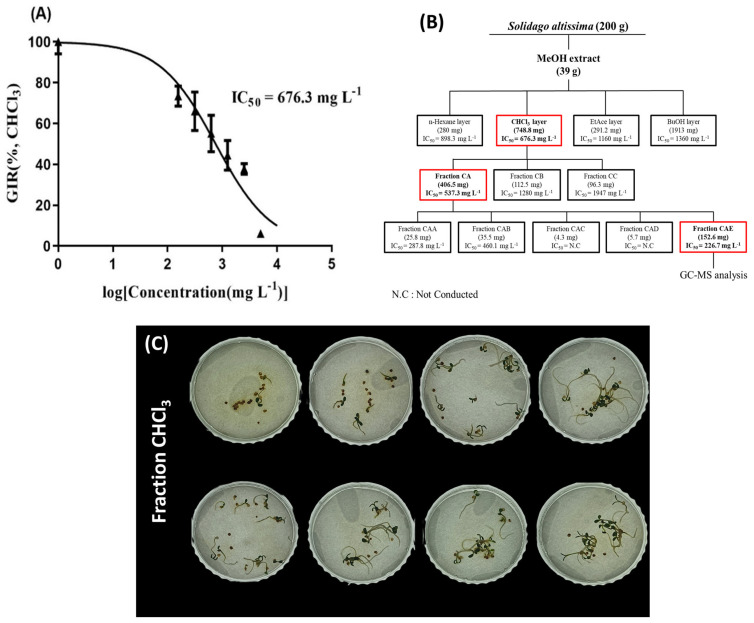
Figure 9.
(A) Curve illustrating the germination inhibition rate (GIR) of T. repens after treatment with the CHCl3 fraction, with an IC50 of 676.3 mg/L. Error bars represent the standard deviation (SD) (n = 3). (B) Schematic diagram of the liquid–liquid extraction process and fraction distribution of SRE. (C) Visual observation of the dose-dependent effect of CHCl3 fraction treatment on SRE in T. repens germination.

