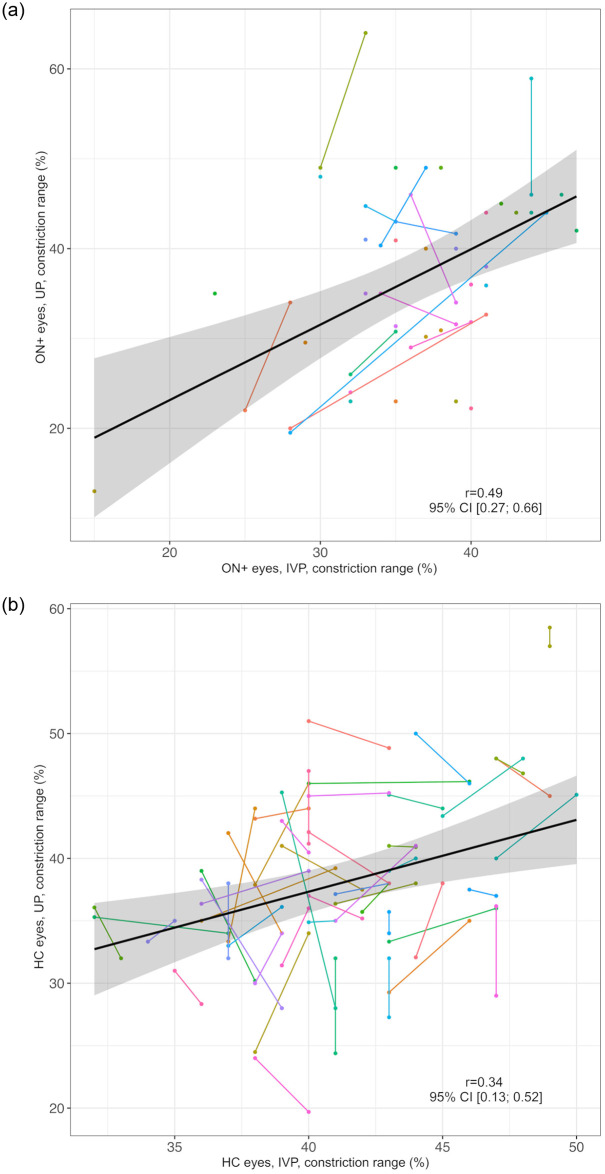
Fig 3. Correlation of constriction range as measured by UP and IVP.
a) ON+ eyes Black line = regression line, grey area = 95% confidence interval, IVP = infrared video pupillometry, ON+ eyes = eyes with optic neuritis, r = correlation coefficient of constriction range in IVP and UP, UP = ultrasound pupillometry, 95% CI = 95% confidence interval. Individuals are represented by different colors; two dots of the same color represent both ON+ eyes (right and left) of one individual. b) HC eyes Black line = regression line, grey area = 95% confidence interval, HC = healthy controls, IVP = infrared video pupillometry, r = correlation coefficient of constriction range in IVP and UP, UP = ultrasound pupillometry, 95% CI = 95% confidence interval. Individuals are represented by different colors; two dots of the same color represent both ON+ eyes (right and left) of one individual.

