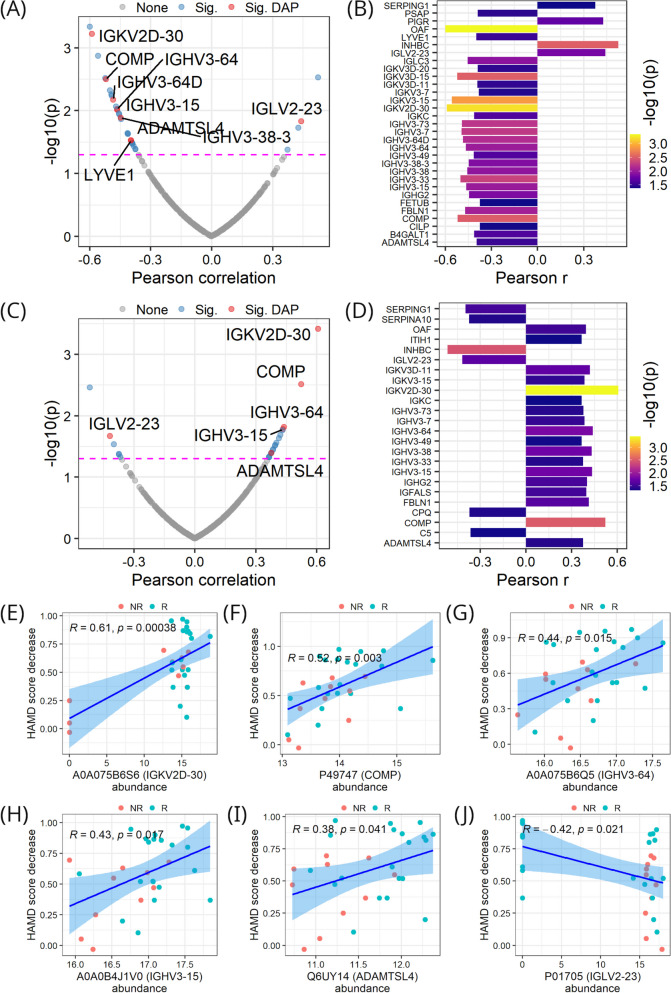
Fig. 5.
Protein correlation with HAMD scores. A Correlation of proteins with HAMD scores measured post-treatment across samples. B Proteins in A significantly correlated with post-treatment HAMD scores. C Correlation of proteins with decreases in HAMD scores from pre-treatment to post-treatment across samples. D Proteins in C significantly correlated with HAMD score decreases. E-J Correlations of individual proteins with HAMD score decreases. In A and C, magenta dashed lines denote the p value (i.e., 0.05) threshold for a significant correlation; Sig represents significantly correlated; Sig DAP denotes significantly correlated DAP

