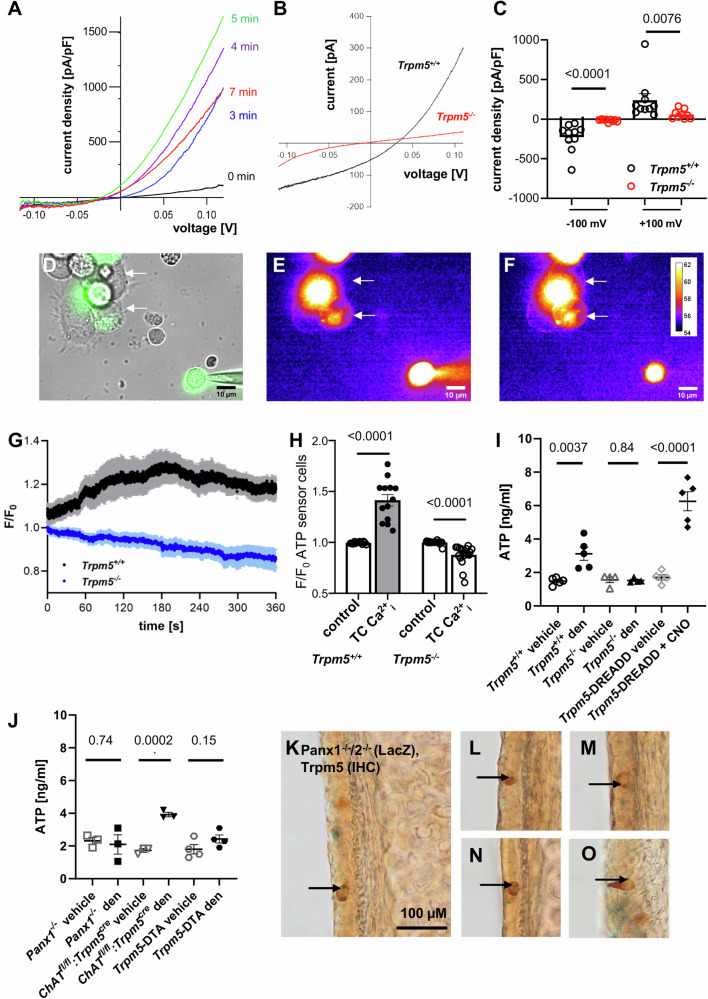
Fig. 1. Tuft cells release ATP and express pannexin 1.
A Representative I-V relationships of TRPM5 current amplitudes normalized to cell size (pA/pF) measured in a tuft cell at indicated time points after breaking the cell. B Representative current-voltage (I-V) relationships of whole-cell currents measured in a tracheal tuft cell from a Trpm5+/+ or a Trpm5−/− mouse in the presence of 1 µM intracellular Ca2+. C Statistical analysis (two-tailed Mann-Whitney test) of currents illustrated in (B). Current amplitude densities measured at −100 mV and +100 mV in Trpm5−/− tuft cells (n = 9 cells) and Trpm5+/+ tuft cells (n = 10 cells) are shown. D The bright field of a patched tuft cell (green, GFP + ) and ATP sensor cells (arrow) shown in E-F. E–F Representative images from a recording of the membrane fluorescence of two ATP sensor cells (arrow) before (E) and after (F) application of Ca2+ containing intracellular solution into a tuft cell through the patch pipette (for n = 5 mice/5 experiments). G The fluorescence intensity of all ATP sensor cells over the whole-cell recording of Trpm5+/+ (black, n = 11 cells/5 mice/5 experiments) or Trpm5−/− tuft cells (blue, n = 9 cells/4 mice/4 experiments). H Statistical analyses of maximal fluorescence intensity of all ATP sensor cells responding to tuft cell stimulation in Trpm5+/+ mice (n = 13 cells/5 mice/5 experiments) and Trpm5−/− mice (n = 19 cells/4 mice/4 experiments). Control = baseline fluorescence, tuft cell Ca2+i = fluorescence after tuft cell stimulation with intracellular Ca2+; two-tailed paired Student’s t-test. I ATP levels in supernatants from denatonium- and vehicle-treated tracheae of Trpm5+/+ mice (n = 5) and Trpm5−/− mice (n = 4), as well as in supernatants from clozapine-N-oxide (CNO, 100 µM, n = 5)- and vehicle-treated (n = 5) Trpm5-DREADD mice. Two-tailed unpaired Student’s t-test. J ATP levels in supernatants from denatonium- and vehicle-treated tracheae from Panx1−/− (n = 3), ChATfl/fl:Trpm5cre (n = 3), and Trpm5- DTA mice (n = 4). Two-tailed unpaired Student’s t-test. K–O Immunohistochemistry for Trpm5 combined with LacZ-staining in the tracheal epithelium of Panx1−/−/2−/− mice (n = 3). Arrows indicate LacZ-staining (blue) in the nuclei of Trpm5+ cells (brown). Source data are provided in the Source Data file. Data in panels (C, G, H, I and J) are presented as mean ± SEM.

