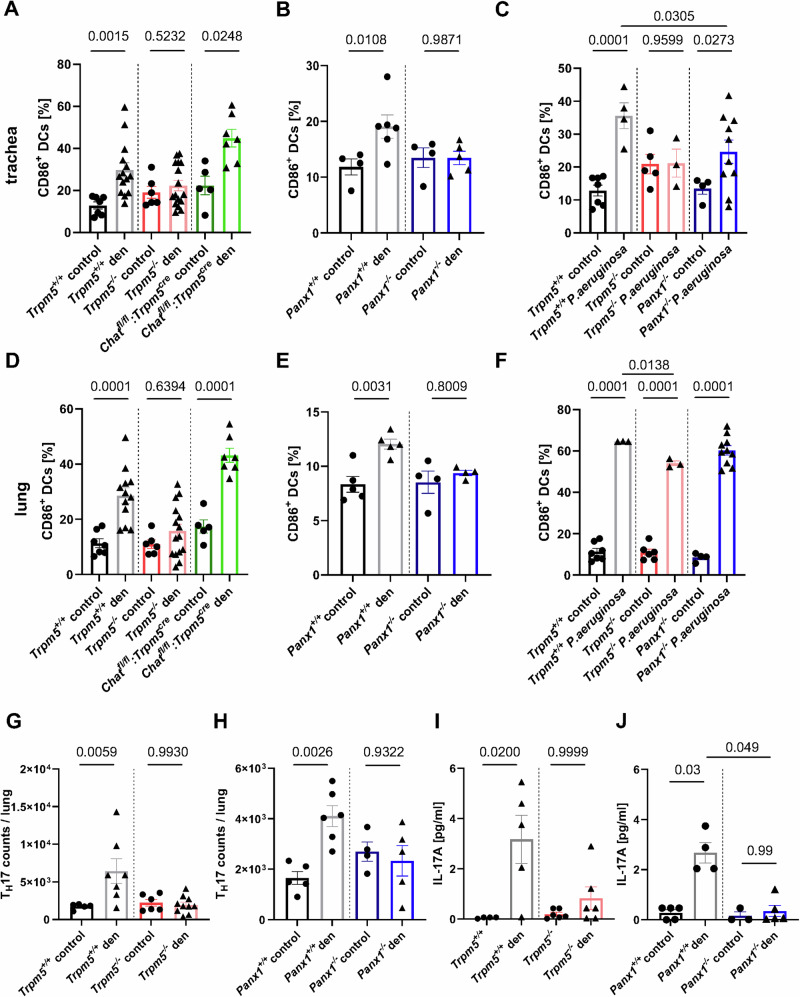
Fig. 5. FACS analyses of the percentage of activated (CD11b+, CD11c+, F4/80-, CD86+) dendritic cells (DCs) and TH17 cell recruitment after three days.
A Percentage of CD86+ DCs in tracheae of denatonium-treated (1 mM) Trpm5+/+ (n = 14), controls (n = 7), Trpm5−/− mice (control n = 6, den n = 16) and Chatfl/fl:Trpm5cre mice (control n = 5, den n = 7). Kruskal-Wallis test. B Percentage of CD86+ DCs in tracheae of denatonium-treated or control Panx1+/+ (control n = 4, den n = 6) and Panx1−/− mice (control n = 4, den n = 5). One-way ANOVA. C Percentage of CD86+ DCs in tracheae three days post infection or in uninfected controls in Trpm5+/+ (control n = 7, P.a. n = 4), Trpm5−/− (control n = 5, P.a. n = 3) and Panx1−/− mice (control n = 4, P.a. n = 10). One-way ANOVA. D Percentage of CD86+ DCs in lungs of denatonium-treated Trpm5+/+ (n = 12), control (n = 7), Trpm5−/− mice (control n = 6, den n = 15) and Chatfl/fl:Trpm5cre mice (control n = 5, den n = 7). One-way ANOVA. E Percentage of CD86+ DCs in lungs of denatonium-treated or control Panx1+/+ (n = 5) and Panx1−/− (n = 4) mice. Unpaired Student’s t-test. F Percentage of CD86+ DCs in lungs three days post infection or in uninfected controls of Trpm5+/+ (control n = 7, P.a. n = 3), Trpm5−/− (control n = 6, P.a. n = 3) and Panx1−/− mice (control n = 4, P.a. n = 10). One-way ANOVA. G FACS analysis of TH17 cells in lungs of denatonium-treated Trpm5+/+ (n = 7) and Trpm5−/− (n = 10) mice or controls (Trpm5+/+ n = 5, Trpm5−/− n = 6). One-way ANOVA. H TH17 cell counts from lungs of denatonium-treated and control Panx1+/+ (control n = 5, den n = 6) and Panx1−/− mice (control n = 4, den n = 5). One-way ANOVA. I IL-17A levels in plasma samples in control or denatonium-treated Trpm5+/+ (control n = 4, den n = 5) and Trpm5−/− (control n = 6, den n = 6) mice. Kruskal-Wallis test. J IL-17A levels in plasma samples of control (n = 5) or denatonium-treated Panx1+/+ mice (n = 4) or Panx1−/− mice (control n = 3, den n = 5). Kruskal-Wallis test. Source data are provided in the Source Data file. Data in panels A–J are presented as mean ± SEM.

