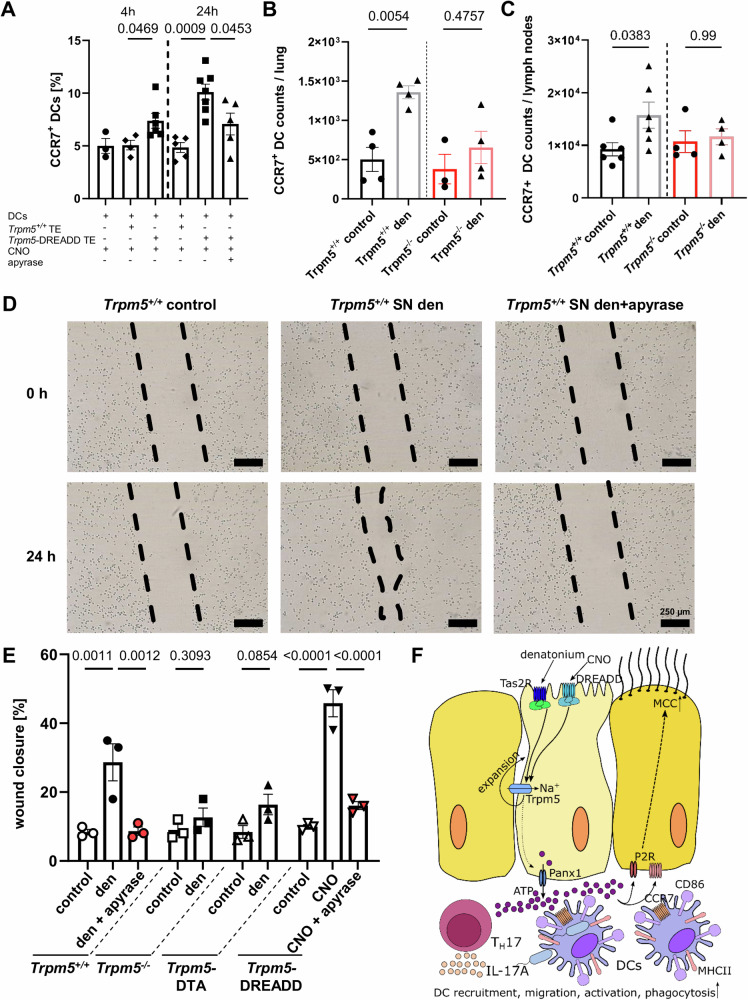
Fig. 7. Tuft cell-induced dendritic cell (DC) phagocytic activity and migration is dependent on ATP.
A Co-culture of CNO-stimulated Trpm5-DREADD tracheal epithelium (TE) with DCs significantly increased the percentage of CCR7-expressing DCs after 4 h (n = 6 mice) and 24 h (n = 7 mice) compared to CNO-treated Trpm5+/+ TE co-culture with DCs (4 h: n = 4 mice, 24 h: n = 5 mice). The increase in % of CCR7+ DCs after 24 h was abolished by apyrase (5 U/ml) (n = 5 mice). DCs cultured alone and treated with CNO (n = 3 mice) exhibited the same percentage of CCR7-expressing cells as DCs co-cultured with Trpm5+/+ TE. One-way ANOVA. B The number of CCR7-expressing DCs in lungs increased significantly 3 days after intratracheal tuft cell stimulation with 1 mM denatonium in Trpm5+/+ mice in contrast to Trpm5−/− mice (n = 4). One-way ANOVA. C In Trpm5+/+ mice (n = 6) CCR7-expression DC counts in lymph nodes are increased 3 days after denatonium treatment, but not in Trpm5−/− mice (n = 4). Kruskal-Wallis test. D DC migration under different experimental conditions: untreated, treated with supernatants (SN) from denatonium-treated Trpm5+/+ mice without and with apyrase. E Quantification of (D). DCs treated with supernatants of unstimulated tracheae of Trpm5+/+, Trpm5-DREADD, Trpm5−/− and Trpm5-DTA mice as well as with supernatants of tracheae stimulated with 1 mM denatonium of Trpm5+/+ mice with and without apyrase (5 U/ml), of denatonium-treated Trpm5−/− and Trpm5-DTA tracheae, and from CNO-treated (100 µM) Trpm5-DREADD tracheae with and without apyrase. Wound closure was evaluated 24 h after induction of the scratch (n = 3). One-way ANOVA or two-tailed unpaired Student’s t-test. F Graphical summary. Stimulation of tuft cells with denatonium or CNO activates the Trpm5 channel, resulting in ATP release via pannexin 1 and tuft cell expansion. The released ATP drives DC recruitment, migration, activation, and phagocytosis, promotes TH17 cell recruitment and IL-17A secretion. Source data are provided in the Source Data file. Date in panels A, B, C and E are presented as mean ± SEM.

