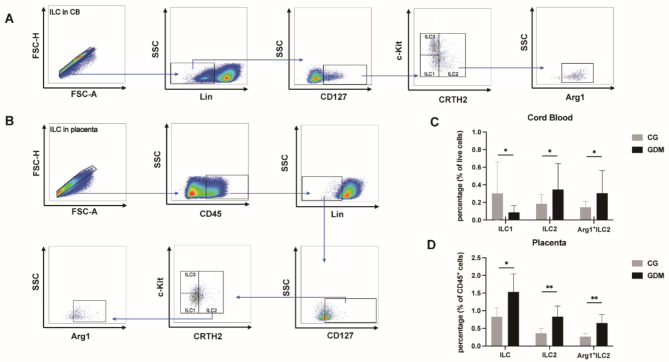
Fig. 1.
Strategy for gating of ILCs in CB and placenta samples using flow cytometry. (A and B) ILCs were sorted into three subgroups: ILC1, Lin−CD127+c-Kit−CRTH2−; ILC2, Lin−CD127+CRTH2+; ILC3, Lin−CD127+c-Kit+CRTH2− (FMO staining of PBMCs and placental tissue is shown in supplementary Fig. 1 and supplementary Fig. 2, respectively). (C and D) As Arg1 expression is thought to be responsible for the activity and function of ILC2s, the percentage of ILC1s, ILC2s, and Arg1+ILC2s was evaluated in the CB and placenta samples. CB, cord blood; GDM, gestational diabetes mellitus; CG, control group; * P < 0.05, ** P < 0.01, *** P < 0.001, **** P < 0.0001.

