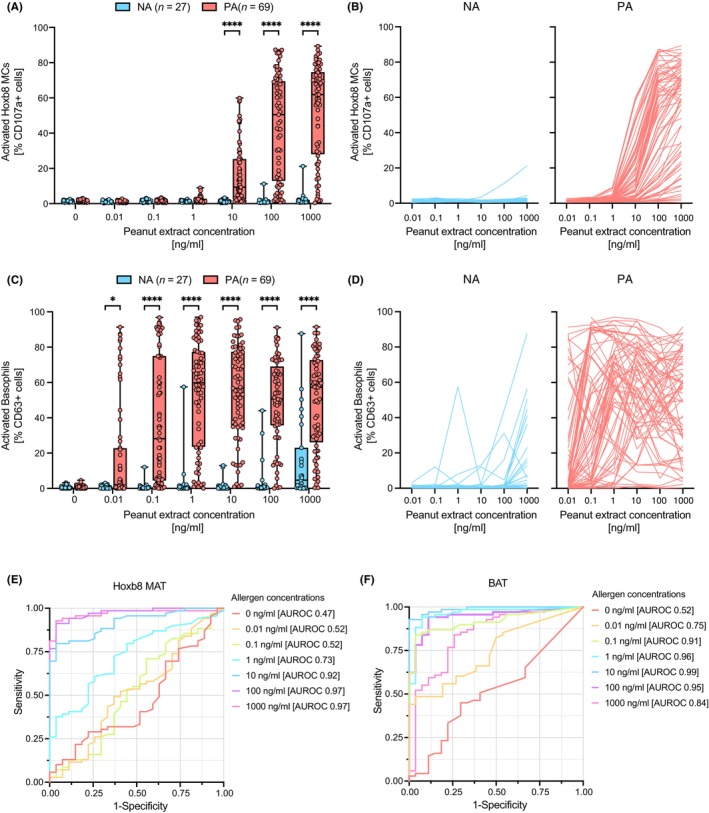
FIGURE 2.

Performance analysis of Hoxb8 MAT and BAT to differentiate between clinically confirmed nonallergic controls and peanut allergic patients. Passively sensitized Hoxb8 MCs (A and B) or whole blood (C and D) were stimulated with peanut allergen extract at various doses (0–1000 ng/mL). Comparison of activated Hoxb8 MCs or blood basophils in the nonallergic (NA) and peanut allergic (PA) group on a population basis is shown (A and C). Dose–response curves of activated Hoxb8 MCs and blood basophils for individual patient samples are represented in two separate subpanels (B and D). Nonallergic controls are depicted in blue, while peanut allergic patients are represented in red. (E and F) ROC curve analyses for Hoxb8 MAT and BAT results across different allergen concentrations (color coded) are depicted and AUROC values are indicated. Data are shown as individual data points and means ± SEMs. *p < .05, ****p < .001.
