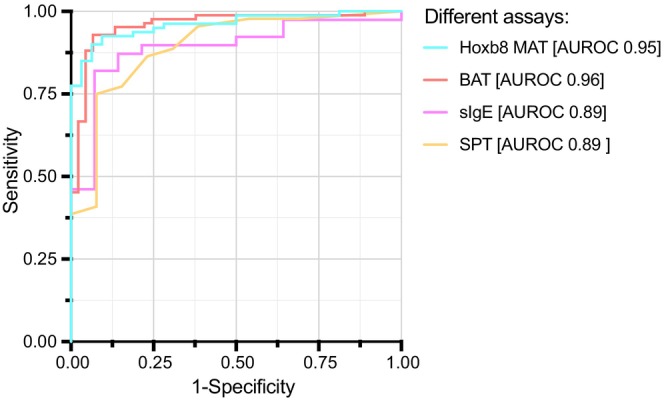
FIGURE 5.

Direct comparison of performance analyses between different diagnostic tests. Direct ROC curve analysis for SPT and sIgE against peanut extract compared with ROC curve analysis of logistic regression models with Hoxb8 MAT and BAT results including all peanut allergen concentrations are depicted (color coded) and AUROC values are indicated.
