

Abstract
Objective
This investigation attempted to examine the effectiveness of CT-derived peritumoral and intratumoral radiomics in forecasting microsatellite instability (MSI) status preoperatively among gastric cancer (GC) patients.
Methods
A retrospective analysis was performed on GC patients from February 2019 to December 2023 across three healthcare institutions. 364 patients (including 41 microsatellite instability-high (MSI-H) and 323 microsatellite instability-low/stable (MSI-L/S)) were stratified into a training set (n = 202), an internal validation set (n = 84), and an external validation set (n = 78). Radiomics features were obtained from both the intratumoral region (IR) and the intratumoral plus 3-mm peritumoral region (IPR) on preoperative contrast-enhanced CT images. After standardizing and reducing the dimensionality of these features, six radiomic models were constructed utilizing three machine learning techniques: Support Vector Machine (SVM), Linear Support Vector Classification (LinearSVC), and Logistic Regression (LR). The optimal model was determined by evaluating the Receiver Operating Characteristic (ROC) curve's Area Under the Curve (AUC), and the radiomics score (Radscore) was computed. A clinical model was developed using clinical characteristics and CT semantic features, with the Radscore integrated to create a combined model. Used ROC curves, calibration plots, and Decision Curve Analysis (DCA) to assess the performance of radiomics, clinical, and combined models.
Results
The LinearSVC model using the IPR achieved the highest AUC of 0.802 in the external validation set. The combined model yielded superior AUCs in internal and external validation sets (0.891 and 0.856) in comparison to clinical model [(0.724, P = 0.193) and (0.655, P = 0.072)] and radiomics model [(0.826, P = 0.160) and (0.802, P = 0.068)]. Furthermore, results from calibration and DCA underscored the model's suitability and clinical relevance.
Conclusion
The combined model, which integrates IPR radiomics with clinical characteristics, accurately predicts MSI status and supports the development of personalized treatment strategies.
Supplementary Information
The online version contains supplementary material available at 10.1186/s12885-025-13450-3.
Keywords: Radiomics, Gastric cancer, Microsatellite instability, Peritumoral, Machine learning
Introduction
In China, statistics from 2020 reveal that the incidence and mortality rates of GC are the third highest within all solid tumors [1]. The Cancer Genome Atlas has recognized microsatellite instability (MSI) as a defining marker for a specific molecular subtype of GC [2]. MSI not only serves as a predictor of disease prognosis but also provides critical information for targeted therapies [3]. MSI arises from defective DNA mismatch repair (dMMR), leading to the accumulation of mutations in short repetitive DNA sequences [4]. In 2017, the monoclonal antibody drug pembrolizumab received approval for the treatment of unresectable or metastatic solid tumors with MSI-H/dMMR characteristics [5]. Beyond its role in cancer immunotherapy, MSI status in GC patients is closely linked to the efficacy of adjuvant chemotherapy [6], overall survival rates, and response to immunosuppressants [7]. Consequently, accurately determining MSI status is essential for devising personalized treatment plans for GC patients.
Authoritative institutions or societies recommend conducting MSI status testing on all newly diagnosed GC patients, utilizing methods such as polymerase chain reaction or immunohistochemical staining [8, 9]. Nonetheless, these tests necessitate samples derived from preoperative biopsies or postoperative pathology specimens. Tumor tissue MSI status can exhibit spatial and temporal heterogeneity across various stages and treatment courses, posing notable challenges for numerous histological techniques [10]. Moreover, factors such as contraindications to endoscopy or surgery, serious complications from endoscopic procedures, poor specimen quality, and the need to avoid unnecessary biopsies in metastatic patients can hinder the effectiveness of histological examination. Additionally, MSI evaluation is not only intricate but may also be challenging to execute in certain medical facilities. Consequently, discovering a relatively non-invasive and practical surrogate biomarker to forecast MSI status in GC will greatly advance precision therapy.
Computed tomography (CT) is the preferred non-invasive method for evaluating GC, with radiomics providing a way to extract high-throughput quantitative imaging features. These features have potential in quantifying both intra- and inter-tumor heterogeneity [11]. At present, research in radiomics for GC mainly concentrates on predicting preoperative lymph node metastasis, Lauren classification, and GC prospect [12–14], among other aspects. Recent studies have also elucidated the role of radiomics in forecasting MSI status in both colorectal cancer and GC [15, 16]. Prior investigations have largely concentrated on the intratumoral region (IR). The peritumoral region, emblematic of the tumor microenvironment, is widely recognized for its significant role in influencing the tumor's therapeutic response and other characteristics [17]. Combining intratumoral and peritumoral region (IPR) radiomics has proven useful in predicting lung cancer recurrence rates and tumor dissemination through the airspaces [18, 19]. Furthermore, Chen et al. [20] indicated that CT-based IPR radiomics could predict MSI status in GC. However, the limitations of their single-center study prevented validation of its external generalizability. To address this, we have initiated a multicenter study with the goal of creating a clinical-radiomics model using IPR to forecast MSI status in GC and to validate its generalizability.
Materials and methods
Patient selection
The investigation received approval from the ethics review committees of three institutions: the Second Affiliated Hospital of Zhejiang University School of Medicine (I), the People's Hospital of Pingyang (II), and the Ningbo Yinzhou NO.2 Hospital (III). The study followed the Declaration of Helsinki principles. 747 GC patients from the three institutions between February 2019 and December 2023 were considered for inclusion. Inclusion criteria: 1. histopathologically verified diagnosis of GC; 2. contrast-enhanced CT scans conducted within a month before surgery; 3. MSI status determined by immunohistochemistry. Exclusion criteria: 1. any form of pre-surgery adjuvant treatment; 2. low-resolution CT scans due to factors such as inadequate gastric filling, suboptimal gastric dilatation, and substantial motion artefacts; 3. incomplete clinical data; 4. gastric stump carcinoma; 5. lesions not clearly identifiable on the CT scans. Consequently, 364 patients were incorporated into this investigation (Fig. 1). Individuals from Institutions I and II were arbitrarily assigned to the training (n = 202) and internal validation (n = 84) sets on a 7:3 basis, while those from Institution III were designated as an autonomous external validation set (n = 78).
Fig. 1.

The fowchart of patient selection
Data collection
Preoperative patient characteristics were meticulously retrieved from electronic medical records, and a retrospective analysis was conducted on a range of variables, including: (1) patient demographics and clinical attributes such as age, gender, body mass index, hemoglobin levels, plasma albumin levels, neutrophil-to-lymphocyte ratio, glycosylated hemoglobin, preoperative carcinoembryonic antigen levels, carbohydrate antigen levels, and Alpha-Fetoprotein values; (2) The original CT adhered to the GC TNM staging guidelines from the 8th edition of the American Joint Committee on Cancer [21]. The CT semantic features encompassed the CT-based T-stage (cT stage), N-stage (cN stage), TNM stage (cTNM stage), tumor length, Borrmann classification, and tumor location which was categorized into the upper, middle, and lower thirds. During the venous phase, the mean CT attenuation values of tumor parenchyma (CTAVtumor) and abdominal aorta (CTAVaorto) were determined, and the normalized tumor enhancement ratio (NTER) was calculated as CTAVtumor / CTAVaorto [22]. All images obtained were evaluated by two radiologists who were blinded of the histopathological findings. In cases of disagreement, a third chief physician was consulted for interpretation.
CT examination
All individuals received comprehensive abdominal enhanced CT scans within one month prior to surgery. Before scanning, individuals were instructed to consume 800–1000 mL of water within 15–20 min. Individuals were placed supine and underwent scanning from the diaphragm to the pubic symphysis. Institution I utilized 64-slice CT scanner (Siemens Somatom Definition AS Sliver) and 256-slice CT scanner (Siemens Somatom Force). Institution II utilized 64-slice CT scanner (Siemens Somatom Definition AS Sliver). Institution III utilized 64-slice CT scanner (GE Optima CT660). The scanning parameters included a tube voltage of 120 kV, automatically adjusted tube current, an interval of 0.6–1.25 mm, and a slice thickness of 3–5 mm. Following a standard non-enhanced CT examination, individuals were administered either iohexol (320 mg/mL) or lopromide (350 mg/mL) via elbow vein at 3.0 mL/s and 1.5 mL/kg. Venous CT scan was conducted with delays of 65–70 s.
ROI segmentation
CT scan data from GC patients were exported in the DICOM format. Venous phase images were imported into the Dr. Wise Multimodal Research Platform (https://keyan.deepwise.com). Two experienced radiologists, blinded with the clinical and pathological results, manually delineated the volume of interest (VOI) in the axial position. The region of interest (ROI) was consistently outlined on consecutive slices starting from the lesion site, resulting in two distinct VOIs: VOI 1 (consisting of IR only) and VOI 2 (including both IR and peritumoral region (PR)). Within the Dr. Wise Multimodal Research Platform, the "Lesion Expansion" function was used to expand VOI 1 by 3 mm. Subsequently, the intestine, adjacent organs, and large blood vessels were manually removed from VOI 2 to finalize its depiction. Figure 2 illustrates the VOI depiction process. Any inconsistencies in tumor boundary delineation should be addressed through collaborative discussions. To evaluate feature extraction repeatability, one radiologist picked 30 individuals arbitrarily for re-segmentation one month after the initial process.
Fig. 2.

Examples of manually sketching the region of interest at a certain venous phase CT slice. The intratumoral region (IR) was delineated as the red region (VOI 1) and the intratumoural plus 3-mm peritumoural region (IPR) tissue was delineated as the yellow region (VOI 2)
Radiomics feature extraction and selection
Radiomics features were extracted from each VOI. After automatic resampling of CT images, the platform (it is deployed on the Alibaba Cloud platform, where the machine learning modules utilize various packages within Python, primarily the scikit-learn library; data anonymization is carried out using a dedicated tool called Washfile, which effectively de-identifies sensitive patient information) generated 2,153 quantitative features, including 414 first-order features, 14 shape features, 552 Gy-level co-occurrence matrix features, 368 Gy-level size zone matrix (GLSZM) features, 368 Gy-level run length matrix (GLRLM) features, 322 Gy-level dependence matrix (GLDM) features, and 115 neighborhood gray-tone difference matrix features. These features were initially standardized and then scaled to unit variance by . The robustness of feature extraction for Reader 1 at different time points and the consistency between the two radiologists were evaluated by intra-class correlation coefficient (ICC1) and inter-rater correlation coefficient (ICC2). Features with ICC1 and ICC2 values exceeding 0.75 were considered to be of good quality and thus included in the subsequent analysis stage.
An inaugural feature correlation analysis was executed, purging any features with a correlation coefficient higher than 0.9. Pairs of independent variables in the training set with a linear correlation coefficient above a predefined threshold had one feature systematically eliminated to reduce redundancy. After completing the feature correlation analysis, feature selection was performed using the L1 method, which involved applying L1 norm penalties to the linear model. A linear model was established using training dataset, resulting in a sparse coefficient matrix. The parameter C was used to adjust the strictness of feature curation; decreasing the C value results in the retention of a smaller number of features.
Model construction and evaluation
Three machine learning algorithms (Support Vector Machine (SVM), Linear Support Vector Classification (LinearSVC), and Logistic Regression (LR)) were employed to build IR and IPR radiomics models. The model that displayed the highest AUC was carefully chosen as the preeminent model, and the ensuing Radscore was meticulously computed. The computational formula was delineated as Radscore = , where denotes the selected feature value, and denotes the regression coefcient of the feature. A univariate analysis was conducted on variables correlated with MSI status, with p-value thresholds for clinical and CT semantic attributes set to less than 0.1. In the next stage, the Akaike Information Criterion (AIC) was employed for selecting best features, with priority given to developing clinical models. The combined model was then carefully engineered through multivariate logistic regression analysis, adroitly amalgamating the Radscore with the clinical model.
All models underwent rigorous evaluations utilizing both internal and external validation sets. Forecasting proficiency of different models was evaluated by AUC. Predictive advantages of these models were compared by Delong test, integrated discrimination improvement index (IDI), and net reclassification improvement index (NRI). The calibration curve assesses the discrepancy between the probabilities predicted by the model and those observed in practice, DCA was employed to evaluate models’ net benefit and practical utility.
MSI status detection
In this study, the expression levels of MMR proteins (MLH1, MSH2, MSH6 and PMS2) were quantified using immunohistochemical staining to determine MSI status, routinely performed by a standard streptavidin biotin–peroxidase procedure. Patients were then classified into the MSI-L/S group, which was positive for all MMR proteins, and the MSI-H group, which was negative for at least one MMR protein.
Statistical analysis
The Kolmogorov–Smirnov test assessed the normality of continuous data. Normally distributed data were presented as mean ± standard deviation and compared using Student's t-test, while non-normally distributed data were presented as median and interquartile range (IQR) and compared with the Mann–Whitney U test. Categorical data were analyzed with chi-square or Fisher’s exact test. Significant variables from univariate analyses were included in a stepwise multivariate binary logistic regression model. ROC curve was utilized to examine the model’s discriminative capacity, calibration curve evaluates the deviation between the model’s predictive probability and observed probability, and DCA determined the clinical utility of the nomogram model. Data analysis was performed with R software, with P < 0.05 considered statistically notable.
Results
Clinical characteristics
Table 1 elucidates that this investigation included 364 patients from three distinct institutions: 159 from Institution 1, 127 from Institution 2, and 78 from Institution 3. The mean age was 69.42 ± 10.42 years, with 272 males and 92 females. The prevalence of MSI-H did not display notable differences among the three institutions (9.43%, 11.81%, and 14.10%, p = 0.549). Patients from Institution 1 and Institution 2 were randomly assigned 7:3 into a training set (n = 202; MSI-H: 22, MSI-L/S: 180) and an internal validation set (n = 84; MSI-H: 8, MSI-L/S: 76). Institution 3 was designated as the external validation set (n = 78; MSI-H: 11, MSI-L/S: 67).
Table 1.
Demographic and clinical characteristics of study subjects at three institutions
| Variables | Total (n = 364) | Institution 1 (n = 159) |
Institution 2 (n = 127) |
Institution 3 (n = 78) |
|---|---|---|---|---|
| Age, Mean ± SD | 69.42 ± 10.42 | 67.04 ± 11.09 | 72.13 ± 9.39 | 69.88 ± 9.54 |
| NTER, Mean ± SD | 0.63 ± 0.14 | 0.66 ± 0.15 | 0.62 ± 0.13 | 0.57 ± 0.14 |
| BMI, Mean ± SD | 22.60 ± 3.30 | 22.76 ± 3.24 | 22.57 ± 3.33 | 22.33 ± 3.39 |
| NLR, M (Q₁, Q₃) | 2.68 (2.00, 3.53) | 2.41 (1.77,3.25) | 2.87 (2.13,3.87) | 2.94 (2.38,3.75) |
| Gender, n (%) | ||||
| Female | 92 (25.27) | 40 (25.16) | 33 (25.98) | 19 (24.36) |
| Male | 272 (74.73) | 119 (74.84) | 94 (74.02) | 59 (75.64) |
| Location, n (%) | ||||
| Upper-third | 44 (12.09) | 32 (20.13) | 8 (6.30) | 7 (8.97) |
| Middle-third | 88 (24.18) | 34 (21.38) | 24 (18.90) | 30 (38.46) |
| Lower-third | 232 (63.74) | 93 (58.49) | 95(74.80) | 41 (52.56) |
| Borrmann, n (%) | ||||
| I | 27 (7.42) | 17 (10.69) | 9 (7.09) | 1 (1.28) |
| II | 70 (19.23) | 20 (12.58) | 36 (28.35) | 14 (17.95) |
| III | 245 (67.31) | 110 (69.18) | 75 (59.06) | 60 (76.92) |
| IV | 22 (6.04) | 12 (7.55) | 7 (5.51) | 3 (3.85) |
| cT stage, n (%) | ||||
| 1–2 | 87 (23.90) | 41 (25.79) | 29 (22.83) | 17 (21.79) |
| 3–4 | 277 (76.10) | 118 (74.21) | 98 (77.17) | 61 (78.21) |
| cN stage, n (%) | ||||
| 0 | 109 (29.95) | 46 (28.93) | 39 (30.71) | 24 (30.77) |
| 1–3 | 255 (70.05) | 113 (71.07) | 88 (69.29) | 54 (69.23) |
| cTNM stage, n (%) | ||||
| I | 52 (14.29) | 28 (17.61) | 14 (11.02) | 10 (12.82) |
| II | 109 (29.95) | 47 (29.56) | 41 (32.28) | 21 (26.92) |
| III | 180 (49.45) | 81 (50.94) | 57 (44.88) | 42 (53.85) |
| IV | 23 (6.32) | 3 (1.89) | 15 (11.81) | 5 (6.41) |
| CEA (mg/ml), n (%) | ||||
| < 5 | 297 (81.59) | 128 (80.50) | 103 (81.10) | 66 (84.62) |
| ≧5 | 67 (18.41) | 31 (19.50) | 24 (18.90) | 12 (15.38) |
| CA199 (U/ml), n (%) | ||||
| < 37 | 300 (82.42) | 135 (84.91) | 100 (78.74) | 65 (83.33) |
| ≧37 | 64 (17.58) | 24 (15.09) | 27 (21.26) | 13 (16.67) |
| AFP (ug/L), n (%) | ||||
| < 20 | 348 (95.60) | 153 (96.23) | 123 (96.85) | 72 (92.31) |
| ≧20 | 16 (4.40) | 6 (3.77) | 4 (3.15) | 6 (7.69) |
| CA125 (U/ml), n (%) | ||||
| < 35 | 344 (94.51) | 152 (95.60) | 119 (93.70) | 73 (93.59) |
| ≧35 | 20 (5.49) | 7 (4.40) | 8 (6.30) | 5 (6.41) |
| Hypoproteinemia, n (%) | ||||
| No | 272 (74.73) | 132 (83.02) | 82 (64.57) | 58 (74.36) |
| Yes | 92 (25.27) | 27 (16.98) | 45 (35.43) | 20 (25.64) |
| Glycosylated hemoglobin (%), n (%) | ||||
| ≦6 | 293 (80.49) | 133 (83.65) | 95 (74.80) | 65 (83.33) |
| ≦> 6 | 71 (19.51) | 26 (16.35) | 32 (25.20) | 13 (16.67) |
| Anaemia, n (%) | ||||
| No | 154 (42.31) | 82 (51.57) | 38 (29.92) | 34 (43.59) |
| Yes | 210 (57.69) | 77 (48.43) | 89 (70.08) | 44 (56.41) |
| Tumor-lenth (cm), n (%) | ||||
| < 5 | 204 (56.04) | 89 (55.97) | 71 (55.91) | 44 (56.41) |
| ≧5 | 160 (43.96) | 70 (44.03) | 56 (44.09) | 34 (43.59) |
| MSI, n (%) | ||||
| MSI-L/S | 323 (88.74) | 144 (90.57) | 112 (88.19) | 67 (85.90) |
| MSI-H | 41 (11.26) | 15 (9.43) | 15 (11.81) | 11 (14.10) |
SD Standard Deviation, M Median, Q₁ 1st Quartile, Q₃ 3st Quartile, TNM Tumor Node Metastasis, CEA Carcino Embryonic Antigen, CA199 Cancer Antigen 199, CA125 Cancer Antigen 125, AFP Alpha Fetoprotein, NTER Normalized Tumor Enhancement Ratio, NLR Neutrophil-to-Lymphocyte Ratio, BMI Body Mass Index, MSI Microsatellite Instability
Radiomics model development
As delineated in Table 2, among the six radiomics models evaluated, the IPR LinearSVC model performed exceptionally well, achieving the highest AUC values in internal validation set (0.826, 95% CI: 0.665–0.987) and external validation set (0.802, 95% CI: 0.648–0.955). Consequently, it was chosen as the best radiomics model. Figure 3 illustrates that the Radscore for each patient was automatically calculated based on 11 radiomics features (four first-order attributes and seven texture features (one from the GLDM, five from GLSZM, and one from GLRLM)). The IR models contains 20 radiomics features. Notably, the IPR models, which were constructed employing LinearSVC, SVM, and Logistic Regression machine learning methods, demonstrated superior performance in the external validation set. Compared to their respective IR models, the AUC values of these methods were improved as follows: LinearSVC (0.802 vs. 0.708), SVM (0.734 vs. 0.620), and Logistic Regression (0.750 vs. 0.668).
Table 2.
Predictive performance comparison of the three types of machine learning algorithms in the datasets
| Model | Dataset | AUC (95%CI) | Accuracy | Sensitivity | Specificity |
|---|---|---|---|---|---|
| LinearSVC (IPR) | Training set | 0.866(0.790–0.943) | 75.74% | 77.27% | 75.56% |
| Internal validation set | 0.826(0.665–0.987) | 71.43% | 75.00% | 71.05% | |
| External validationset | 0.802(0.648–0.955) | 74.36% | 72.73% | 74.63% | |
| SVM (IPR) | Training set | 0.830(0.723–0.937) | 77.23% | 77.27% | 77.22% |
| Internal validation set | 0.701(0.490–0.911) | 75.00% | 62.50% | 76.32% | |
| External validation set | 0.734(0.597–0.872) | 74.36% | 63.64% | 76.12% | |
| LogisticRegression (IPR) | Training set | 0.807(0.710–0.904) | 68.32% | 81.82% | 66.67% |
| Internal validation set | 0.712(0.535–0.890) | 61.90% | 62.50% | 61.84% | |
| External validation set | 0.750(0.634–0.867) | 67.95% | 72.73% | 67.16% | |
| LinearSVC (IR) | Training set | 0.864(0.798–0.930) | 76.73% | 86.36% | 75.56% |
| Internal validation set | 0.758(0.652–0.865) | 69.05% | 62.50% | 69.74% | |
| External validation set | 0.708(0.495–0.921) | 75.64% | 63.64% | 77.61% | |
| SVM (IR) | Training set | 0.848(0.763–0.933) | 65.84% | 90.91% | 62.78% |
| Internal validation set | 0.739(0.598–0.879) | 59.52% | 75.00% | 57.89% | |
| External validation set | 0.620(0.408–0.832) | 62.82% | 63.64% | 62.69% | |
| LogisticRegression (IR) | Training set | 0.921(0.880–0.963) | 80.20% | 90.91% | 78.89% |
| Internal validation set | 0.776(0.654–0.899) | 71.43% | 62.50% | 72.37% | |
| External validation set | 0.668(0.449–0.886) | 74.36% | 54.55% | 77.61% |
SVM Support Vector Machine, LinearSVC Linear Support Vector Classification, IR Intratumoral Region, IPR Intratumoural 3-mm Peritumoural Region, AUC Area Under the Curve
Fig. 3.

Radiomics features and coefcients of intratumoral and peritumoral regions. The abscissa represents the coefcients, and the ordinate represents the feature
Clinical model and combined model construction
Based on the findings of univariate and multivariate logistic regression analyses, we developed a clinical model incorporating age, NTER, tumor length, and cN stage as independent predictor variables. The Radscore, derived from radiomics analysis, was combined with these clinical variables for multivariate logistic regression analyses. As detailed in Table 3, these comprehensive analyses demonstrated that age (OR 1.08, 95% CI: 1.01–1.16, P = 0.046), NTER (OR 3.54e-4, 95% CI: 1e-6–0.05, P = 0.003), cN stage (OR 0.19, 95% CI: 0.05–0.67, P = 0.010), and Radscore (OR 28.03, 95% CI: 6.22–126.32, P < 0.001) were statistically notable predictors of MSI status. This rigorous analysis process resulted in the creation of a combined model integrating these variables and their respective derived coefficients.
Table 3.
Univariate and Multivariate logistic regression analyses of factors influencing MSI status in gastric cancer
| Variables | Univariate analysis | Multivariate analysis | ||||
|---|---|---|---|---|---|---|
| β | P | OR (95%CI) | β | P | OR (95%CI) | |
| Gender | ||||||
| Female | 1.00 (Reference) | |||||
| Male | 0.05 | 0.917 | 1.05 (0.39 ~ 2.84) | |||
| Location | ||||||
| Upper-third | 1.00 (Reference) | |||||
| Middle-third | −1.49 | 0.208 | 0.23 (0.02 ~ 2.29) | |||
| Lower-third | 0.24 | 0.717 | 1.27 (0.35 ~ 4.65) | |||
| Borrmann | ||||||
| I | 1.00 (Reference) | |||||
| II | −0.32 | 0.692 | 0.72 (0.15 ~ 3.58) | |||
| III | −0.18 | 0.788 | 0.83 (0.22 ~ 3.16) | |||
| IV | −15.72 | 0.989 | 0.00 (0.00 ~ Inf) | |||
| cT stage | ||||||
| 1–2 | 1.00 (Reference) | |||||
| 3–4 | −0.63 | 0.187 | 0.53 (0.21 ~ 1.36) | |||
| cN stage | ||||||
| 0 | 1.00 (Reference) | 1.00 (Reference) | ||||
| 1–3 | −1.17 | 0.011* | 0.31 (0.13 ~ 0.77) | −1.68 | 0.010* | 0.19 (0.05 ~ 0.67) |
| cTNM stage | ||||||
| I | 1.00 (Reference) | |||||
| II | −0.08 | 0.898 | 0.93 (0.29 ~ 2.99) | |||
| III | −0.92 | 0.142 | 0.40 (0.12 ~ 1.36) | |||
| IV | −15.96 | 0.988 | 0.00 (0.00 ~ Inf) | |||
| CEA≧5(mg/ml) | −0.92 | 0.231 | 0.40 (0.09 ~ 1.79) | |||
| CA199≧37 (U/ml) | −0.31 | 0.629 | 0.73 (0.20 ~ 2.62) | |||
| AFP≧20 (ug/L) | −14.50 | 0.988 | 0.00 (0.00 ~ Inf) | |||
| CA125≧35 (U/ml) | 0.77 | 0.354 | 2.15 (0.43 ~ 10.83) | |||
| Hypoproteinemia | 0.60 | 0.209 | 1.82 (0.72 ~ 4.63) | |||
| Glycosylated hemoglobin > 6 (%) | 0.48 | 0.355 | 1.61 (0.59 ~ 4.42) | |||
| Anaemia | 0.69 | 0.169 | 1.99 (0.75 ~ 5.33) | |||
| Tumor-length≧5 (cm) | 0.80 | 0.083 | 2.22 (0.90 ~ 5.46) | |||
| Age | 0.10 | < 0.001** | 1.11 (1.04 ~ 1.18) | 0.07 | 0.046* | 1.08 (1.01 ~ 1.16) |
| NTER | −4.63 | 0.010* | 0.01 (2.31e-4 ~ 0.29) | −7.95 | 0.003** | 3.54e-4 (1e-6 ~ 0.05) |
| BMI | −0.04 | 0.493 | 0.96 (0.87 ~ 1.07) | |||
| NLR | −0.02 | 0.785 | 0.98 (0.82 ~ 1.16) | |||
| Radscore | 2.84 | < 0.001** | 17.03 (5.60 ~ 51.78) | 3.33 | < 0.001** | 28.03 (6.22 ~ 126.32) |
OR Odds Ratio, CI Confidence Interval, TNM Tumor Node Metastasis, CEA Carcino Embryonic Antigen, CA199 Cancer Antigen 199, CA125 Cancer Antigen 125, AFP Alpha-Fetal Protein, NTER Normalized Tumor Enhancement Ratio, NLR Neutrophil-to-Lymphocyte Ratio, BMI Body Mass Index, Radscore Radiomics score
*p < 0.05, **p < 0.01
Evaluation of model performance
The ROC curves depicted in Fig. 4 and the confusion matrix in Supplementary Table 1, showing that the combined model gained a superior AUC of 0.932 (95% CI: 0.878–0.985) in discerning MSI status in the training set. This performance was markedly better than that of clinical model (AUC 0.813, 95% CI: 0.718–0.908) and radiomics model (AUC 0.866, 95% CI: 0.790–0.943), with statistically significant differences between models (Delong test, both p < 0.05). In the internal validation set, combined model’s AUC was 0.891 (95% CI: 0.772–0.999), demonstrating preeminent performance compared to clinical model (AUC 0.724, 95% CI: 0.525–0.923) and radiomics model (AUC 0.826, 95% CI: 0.665–0.987). In the external validation set, combined model gained an AUC of 0.856 (95% CI: 0.738–0.974), again surpassing both clinical model (AUC 0.655, 95% CI: 0.488–0.823) and radiomics model (AUC 0.802, 95% CI: 0.648–0.955). However, the differences in these comparisons were not statistically significant (Delong test, both p > 0.05).
Fig. 4.

ROC curves of each model to predict MSI status in the training set (A), internal validation set (B) and external validation set (C)
As presented in Table 4, in all three cohorts of training set, internal validation set, and external validation set, radiomics model and combined model showed positive IDI and NRI relative to the clinical model. This signifies that these two models exhibited greater predictive capacities than the clinical model. Notably, the combined model revealed dramatically improved predictive performance in the external validation set (p < 0.05). Additionally, the consistency of AUC for the combined model between external validation set and training set (Delong test, p = 0.256) provided further evidence of the model's effectiveness in preventing overfitting and maintaining strong performance.
Table 4.
Predictive performance using radiomics model, clinical model, and combined model in the training, internal validation and external validation sets
| Dataset | Model type | AUC (95%CI) |
ΔAUC | P-value | IDI (95%CI) | P-value | NRI (95%CI) | P-value |
|---|---|---|---|---|---|---|---|---|
| Training set | Clinic |
0.813 (0.718–0.908) |
- | - | - | - | - | - |
| Radiomics |
0.866 (0.790–0.943) |
0.053 | 0.370 |
0.109 (−0.021–0.239) |
0.101 |
0.068 (−0.202–0.338) |
0.623 | |
| Combined |
0.932 (0.878–0.985) |
0.119 | 0.002 ** |
0.264 (0.156–0.371) |
< 0.001** |
0.335 (0.136–0.533) |
0.001** | |
| Internal validation set | Clinic |
0.724 (0.525–0.923) |
- | - | - | - | - | - |
| Radiomics |
0.826 (0.665–0.987) |
0.102 | 0.510 |
0.179 (−0.117–0.474) |
0.236 |
0.276 (−0.189–0.742) |
0.245 | |
| Combined |
0.891 (0.772–0.999) |
0.167 | 0.193 |
0.305 (0.061–0.550) |
0.014* |
0.599 (0.254–0.944) |
0.001** | |
| External validation set | Clinic |
0.655 (0.488–0.823) |
- | - | - | - | - | - |
| Radiomics |
0.802 (0.648–0.955) |
0.147 | 0.265 |
0.174 (−0.012–0.355) |
0.067 |
0.106 (−0.299–0.510) |
0.608 | |
| Combined |
0.856 (0.738–0.974) |
0.201 | 0.072 |
0.300 (0.099–0.501) |
0.003** |
0.410 (0.111–0.708) |
0.007** |
AUC Area Under the Curve, CI Conffdence Interval, IDI Integrated Discrimination Index, NRI Net Reclassification Index
*p < 0.05, ** p < 0.01
Variables included in the combined model were depicted in a nomogram (Fig. 5), which enabled individualized probability estimations and illustrated the relative significance of each feature. The calibration curves depicted in Supplementary Fig. 1 validated the alignment between the predicted and actual MSI probabilities across all models and cohorts, with Brier scores under 0.25, demonstrating excellent performance. Furthermore, DCA presented in Supplementary Fig. 2 underscores that combined model yielded a superior net benefit within designated threshold probability range, surpassing both clinical and radiomics models in terms of performance.
Fig. 5.
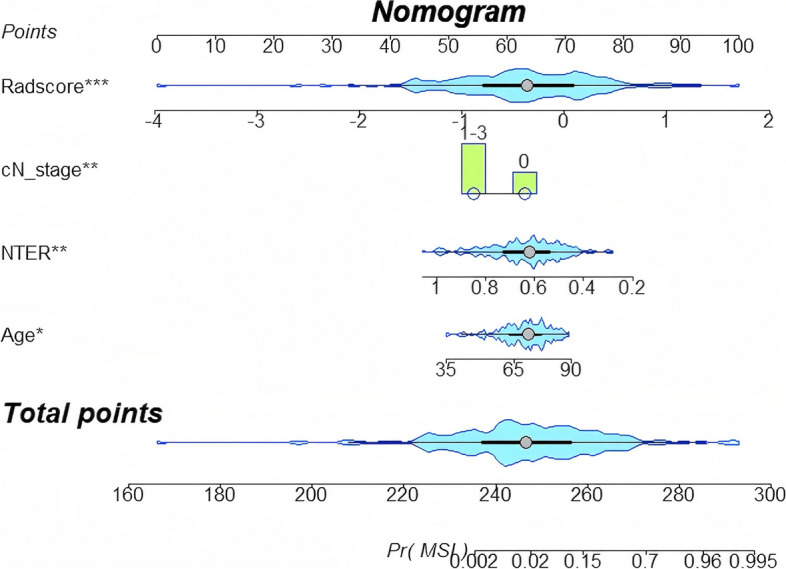
The visualized nomogram of the MSI diagnosing model. MSI diagnosing model for the prediction of MSI-H gastric cancer. From each predictor, draw a vertical line up through the “Points” scale (top row) to get the point and then sum all points from each predictor. Next, find the sum value in the “Total points” scale and draw a vertical line through the probability to get the final predicted probability for MSI status
Discussion
This study discerned that the combined model, constructed employing the LinearSVC machine learning algorithm to extract radiomics features from IPR and integrate them with clinical variables (age, NTER, and cN stage), demonstrated notable effectiveness in predicting the MSI status of GC patients before surgery. The combined model showcased superior predictive power and a better goodness-of-fit in comparison to standalone radiomics model and clinical model. Moreover, DCA confirmed that combined model provides a greater net clinical benefit.
Increasing evidence underscores the importance of accurately determining MSI status, preoperatively, as it significantly influences treatment strategies and patient prognosis. In our cohort, the prevalence of MSI-H was 11.26% (41/364), aligning with the diminished prevalence reported in previous studies [23]. MSI-H arises from defects in mismatch repair mechanisms. Compared to MSI-L/S GC, MSI-H tumors exhibit higher expression of programmed death ligand 1 (PD-L1), greater infiltration of cytotoxic T-lymphocytes, and a greater tumor mutation rate. Consequently, immunotherapy is particularly effective for MSI-H tumors. Research [7] indicates that 76% of patients with advanced GC and MSI-H experience remission following anti-PD-L1 treatment. The positive predictive value (PPV) of the combined model in the external validation set reached 0.962, indicating that in clinical application, for patients predicted to be MSI-H, the accuracy is 96.2%, and these patients will benefit from routine anti-PD-L1 drug (Nivolumab) treatment [24]. Only 3.8% of patients will face the risk of overtreatment due to the use of Nivolumab, a proportion that should be acceptable in clinical application. Moreover, the side effects occasionally caused by Nivolumab are usually mild, including fatigue, itching, and rash, which can be effectively prevented with immunosuppressants such as corticosteroids. Regrettably, the negative predictive value (NPV) of the combined model in the external validation set is only 0.346. In clinical application, patients predicted to be MSI-L/S will face a 65.4% risk of undertreatment, and in such cases, further verification through other diagnostic means may be necessary, prompting patients to follow up accordingly. Despite the low NPV, the model may still have some value in monitoring changes in MSI status.
Machine learning-driven radiomics is increasingly used in diagnosis and personalized therapy. Our research found that the LinearSVC model outperforms both SVM and Logistic Regression models in binary classification tasks, consistent with findings by Qorib et al. [25]. LinearSVC is particularly effective with both dense and sparse inputs and can rapidly converge with larger datasets [26]. Additionally, the performance of IPR radiomics model exceeded that of standalone IR model, highlighting value of features from the 3 mm peritumoral region in forecasting MSI-H status in GC. Owing to the thinness of the gastric wall, distinguishing between tumors and normal tissues can be challenging; thus, a 3 mm margin is considered a practical approximation. The IPR model contains a total of 11 radiomics features, comprising four first-order attributes and seven texture features (one from the GLDM, five from GLSZM, and one from GLRLM). The two features with the highest weights are "log-sigma-2–0-mm-3D_firstorder_90Percentile" and "log-sigma-1–0-mm-3D_gldm_DependenceVariance". The radiomics feature "log-sigma-2–0-mm-3D_firstorder_90Percentile" represents the 90th percentile of pixel intensity values in an image processed by logarithmic scale transformation (log-sigma). Since MSI-H gastric cancers typically contain more mucus components [24],which may exhibit lower density on CT images, this explains why a lower value of NTER in our nomogram corresponds to a higher probability of predicting MSI-H. Therefore, we speculate that the radiomics feature "log-sigma-2–0-mm-3D_firstorder_90Percentile", by reflecting the distribution of higher pixel intensity values in the image, may be related to the density region of the tumour, and thus indirectly to the status of MSI-H. The radiomics feature "log-sigma-1–0-mm-3D_gldm_DependenceVariance" measures the variance of the magnitude of the relationship in the image, which may reflect the roughness and complexity of the image texture. MSI-H tumours are often accompanied by a large number of tumour-infiltrating lymphocytes [24], and thus exhibit an active immune microenvironment, which may influence the CT image features of the tumour. We hypothesize that "log-sigma-1–0-mm-3D_gldm_DependenceVariance" may capture changes in these microenvironments and thus have some correlation with MSI status. Furthermore, we refer to the latest research, which finds that there is crosstalk between MSI status and the tumor microenvironment [27]. MSI-H tumors have more immune cell infiltration, higher expression of immune-related genes, and higher immunogenicity [27]. These findings further support our hypothesis that radiomic features may be related to the tumor's immune microenvironment and MSI status. This biological foundation helps explain why peritumoral radiomics are effective for MSI status prediction. Recent explorations have demonstrated that the IPR model outperforms the IR model in predicting various aspects, including lung adenocarcinoma differentiation [28], GC lymph node metastasis [29], and MSI status in GC [20].
The clinical model based on clinical and CT features identifies age, NTER, tumor length, and cN stage as independent predictors of GC MSI-H, aligning with previous studies [22, 30]. Nonetheless, AUC for this model within external validation set was constrained to 0.655 (95% CI: 0.488–0.823). Notably, Radscore from the IPR model has been validated as a dependable biomarker for predicting MSI status. While the difference in AUC did not achieve statistical significance, the significant increase in ΔAUC suggests a notable improvement in predictive performance [31, 32]. An earlier investigation [33] crafted and validated a radiomics model that synthesized clinical and radiological attributes for the preoperative prediction of MSI in GC. Nevertheless, this study was limited to patients with stage III or IV gastric adenocarcinoma confirmed by postoperative pathology. In contrast, our study encompasses all stages and integrates tumor-surrounding features to enhance predictive accuracy. Chen et al. [20] illuminated that a combined model using intratumoral and peritumoral CECT radiomics features along with clinical factors could moderately forecast preoperative MSI status, but it lacked external validation with independent data cohorts. The rise of radiomics has renewed attention on improving model generalization, with multicenter data and autonomous external testing cohorts offering a promising solution to historically poor generalization [34]. Our combined model exhibited excellent generalization with an AUC of 0.856 (95% CI: 0.738–0.974) in external validation across three institutions. Additionally, the Delong test confirmed that the model did not overfit. In summary, our combined model demonstrates superior efficacy in forecasting preoperative MSI status in GC.
This investigation has several inherent limitations. Firstly, our relatively small sample size and retrospective design means validation through prospective investigations with larger cohorts to improve generalization and accuracy. Secondly, the labor-intensive ROI drawing process lacks standardization, potentially causing variability. For further clinical applicability, automated tools will be necessary to improve scalability and accuracy. Current automated segmentation methods such as deep learning techniques may help to address this issue. Thirdly, as this was a multi-centre study, different CT scanners were used in three institutions, this study lacks image pre-processing techniques that should be made to maintain the image consistency acquired from different devices and settings, and potential bias occurs. Furthermore, only venous phase images were used, and incorporating multi-phase images could further improve the model. Fourthly, CT provides limited information on tumour metabolic or functional characteristics, whereas PET/CT can provide additional metabolic data that could complement radiomics for better MSI prediction. Lastly, while the combined model is effective in predicting MSI status in GC, it cannot fully replace pathological analysis. Future research should explore the biological basis of quantitative features to uncover mechanisms and enhance model applicability.
Conclusion
In conclusion, the combined model using CT radiomics features from both the IR and the 3-mm peritumoral area, along with clinical characteristics, demonstrates commendable accuracy in predicting MSI status in GC. This integrated approach holds significant promise for devising personalized treatment strategies, aiming to achieve more effective interventions. As we gain a deeper understanding of the complexities of GC, the development and validation of predictive models like this one become increasingly crucial, as they can equip clinical practitioners with more informed decision-making tools and enhance patient outcomes and well-being. Subsequent investigations should prioritize validating these models across diverse populations and delving into the biological underpinnings of radiomics features to deepen our clinical context understanding.
Supplementary Information
Acknowledgements
Not applicable.
Abbreviations
- MSI
Microsatellite Instability;
- GC
Gastric Cancer
- MSI-H
Microsatellite Instability-high
- MSI-L/S
Microsatellite Instability-low/stable
- IR
Intratumoral Region
- IPR
Intratumoral plus 3-mm Peritumoral Region
- CT
Computed Tomography
- SVM
Support Vector Machine
- LinearSVC
Linear Support Vector Classification
- LR
Logistic Regression
- ROC
Receiver Operating Characteristic
- AUC
Area Under the Curve
- Radscore
Radiomics score
- DCA
Decision Curve Analysis
- CTAVtumor
The mean CT attenuation values of tumor parenchyma
- CTAVaorto
The mean CT attenuation values of abdominal aorta
- NTER
Normalized tumor enhancement ratio
- ROI
The region of interest
- IDI
Integrated Discrimination improvement Index
- NRI
Net Reclassification improvement Index
- PPV
Positive predictive value
- NPV
Negative predictive value
Authors’ contributions
Y.X. and M.S. were contributed to the conception and design of the study. J.Z. organized the database. H.X. was responsible for the software and statistics. Y.X. took charge of the writing of this paper. Z.W. to data collection. Y.X., Z.H. for data analysis. All authors have read and approved the manuscript.
Funding
This study was supported by the Wenzhou City Science and Technology program (No. Y2023548).
Data availability
The datasets used during the current study are available from the corresponding author on reasonable request.
Declarations
Ethics approval and consent to participate
All procedures performed in studies involving human participants were in accordance with the ethical standards of the institutional and/or national research committee and the 1964 Helsinki Declaration and its later amend ments or comparable ethical standards. This retrospective study was approved by the ethics committee of PingYang People's Hospital (protocol code KT-2023–47, 17 July 2023), the Second Affiliated Hospital of Zhejiang University School of Medicine (protocol code 2024–0946, 8 August 2024), and the Ningbo Yinzhou NO.2 Hospital (protocol code 2024–032, 6 September 2024). The ethical committees of Pingyang People's Hospital, the Second Affiliated Hospital of Zhejiang University School of Medicine, and the Ningbo Yinzhou NO.2 Hospital, waived the requirement for informed consent. We confirm that all methods were performed in accordance with the relevant guidelines.
Consent for publication
Not applicable.
Competing interests
The authors declare no competing interests.
Footnotes
Publisher’s Note
Springer Nature remains neutral with regard to jurisdictional claims in published maps and institutional affiliations.
Yunzhou Xiao and Jianping Zhu contributed equally to this work.
Contributor Information
Zhaohai Huang, Email: Huangzhaoh0329@163.com.
Miaoguang Su, Email: smg9410892022@163.com.
References
- 1.Sung H, Ferlay J, Siegel RL, Laversanne M, Soerjomataram I, Jemal A, et al. Global cancer statistics 2020: GLOBOCAN estimates of incidence and mortality worldwide for 36 cancers in 185 countries. CA Cancer J Clin. 2021;71(3):209–49. [DOI] [PubMed] [Google Scholar]
- 2.Chia NY, Tan P. Molecular Classification of Gastric Cancer. Ann Oncol. 2016; 27(5):763–9. [DOI] [PubMed]
- 3.Cristescu R, Lee J, Nebozhyn M, Kim KM, Ting JC, Wong SS, et al. Molecular analysis of gastric cancer identifies subtypes associated with distinct clinical outcomes. Nat Med. 2015;21(5):449–56. [DOI] [PubMed] [Google Scholar]
- 4.Baretti M, Le DT. DNA Mismatch repair in cancer. Pharmacol Ther. 2018;189:45–62. [DOI] [PubMed] [Google Scholar]
- 5.Le DT, Uram JN, Wang H, Bartlett BR, Kemberling H, Eyring AD, et al. PD-1 Blockade in Tumors With Mismatch-Repair Deficiency. N Engl J Med. 2015;372(26):2509–20. [DOI] [PMC free article] [PubMed] [Google Scholar]
- 6.An JY, Kim H, Cheong JH, Hyung WJ, Kim H, Noh SH. Microsatellite instability in sporadic gastric cancer: its prognostic role and guidance for 5-FU based chemotherapy after R0 resection. Int J Cancer. 2012;131(2):505–11. [DOI] [PubMed] [Google Scholar]
- 7.Pietrantonio F, Randon G, Di Bartolomeo M, Luciani A, Chao J, Smyth EC, et al. Predictive role of microsatellite instability for PD-1 blockade in patients with advanced gastric cancer: a meta-analysis of randomized clinical trials. ESMO Open. 2021;6(1):100036. [DOI] [PMC free article] [PubMed] [Google Scholar]
- 8.Ajani JA, D'Amico TA, Bentrem DJ, Chao J, Cooke D, Corvera C, et al. Gastric Cancer, Version 2.2022, NCCN Clinical Practice Guidelines in Oncology. J Natl Compr Canc Netw. 2022;20(2):167–192. [DOI] [PubMed]
- 9.Wang FH, Zhang XT, Li YF, Tang L, Qu XJ, Ying JE, et al. The Chinese society of clinical oncology (CSCO): Clinical guidelines for the diagnosis and treatment of gastric cancer, 2021. Cancer Commun (Lond). 2021;41(8):747–95. [DOI] [PMC free article] [PubMed] [Google Scholar]
- 10.Fukuda M, Yokozaki H, Shiba M, Higuchi K, Arakawa T. Genetic and epigenetic markers to identify high risk patients for multiple early gastric cancers afte r treatment with endoscopic mucosal resection. J Clin Biochem Nutr. 2007;40(3):203–9. [DOI] [PMC free article] [PubMed] [Google Scholar]
- 11.Gillies RJ, Kinahan PE, Hricak H. Radiomics: Images Are More than Pictures. They Are Data Radiology. 2016;278(2):563–77. [DOI] [PMC free article] [PubMed] [Google Scholar]
- 12.Dong D, Fang MJ, Tang L, Shan XH, Gao JB, Giganti F, et al. Deep learning radiomic nomogram can predict the number of lymph node metastasis in locally advanced gastric cancer: an international multicenter study. Ann Oncol. 2020;31(7):912–20. [DOI] [PubMed] [Google Scholar]
- 13.Wang XX, Ding Y, Wang SW, Dong D, Li HL, Chen J, et al. Intratumoral and peritumoral radiomics analysis for preoperative Lauren classification in gastric cancer. Cancer Imaging. 2020;20(1):83. [DOI] [PMC free article] [PubMed] [Google Scholar]
- 14.Wang S, Feng C, Dong D, Li H, Zhou J, Ye Y, et al. Preoperative computed tomography-guided disease-free survival prediction in gastric cancer: a multicenter radiomics study. Med Phys. 2020;47(10):4862–71. [DOI] [PubMed] [Google Scholar]
- 15.Pei Q, Yi X, Chen C, Pang P, Fu Y, Lei G, et al. Pre-treatment CT-based radiomics nomogram for predicting microsatellite instability status in colorectal cancer. Eur Radiol. 2022;32(1):714–24. [DOI] [PubMed] [Google Scholar]
- 16.Zeng Q, Zhu Y, Li L, Feng Z, Shu X, Wu A, et al. CT-based radiomic nomogram for preoperative prediction of DNA mismatch repair defciency in gastric cancer. Front Oncol. 2022;12:883109. [DOI] [PMC free article] [PubMed] [Google Scholar]
- 17.Altieri R, Barbagallo D, Certo F, Broggi G, Ragusa M, Di Pietro C, et al. Peritumoral Microenvironment in High-Grade Gliomas: From FLAIRectomy to Microglia-Glioma Cross-Talk. Brain Sci. 2021;11(2):200. [DOI] [PMC free article] [PubMed] [Google Scholar]
- 18.Wang T, She Y, Yang Y, Liu X, Chen S, Zhong Y, et al. Radiomics for survival risk stratiffcation of clinical and pathologic stage IA pure-solid non-small cell lung cancer. Radiology. 2022;302(2):425–34. [DOI] [PubMed] [Google Scholar]
- 19.Liao G, Huang L, Wu S, Zhang P, Xie D, Yao L, et al. Preoperative CT-based peritumoral and tumoral radiomic features prediction for tumor spread through air spaces in clinical stage I lung adenocarcinoma. Lung Cancer. 2022;163:87–95. [DOI] [PubMed] [Google Scholar]
- 20.Chen X, Zhuang Z, Pen L, Xue J, Zhu H, Zhang L, et al. Intratumoral and peritumoral CT-based radiomics for predicting the microsatellite instability in gastric cancer. Abdom Radiol (NY). 2024;49(5):1363–75. [DOI] [PubMed] [Google Scholar]
- 21.Ji X, Bu ZD, Yan Y, Li ZY, Wu AW, Zhang LH, et al. The 8th edition of the American Joint Committee on Cancer tumor-node-metastasis staging system for gastric cancer is superior to the 7th edition: results from a Chinese mono-institutional study of 1663 patients. Gastric Cancer. 2018; 21(4):643–652. [DOI] [PMC free article] [PubMed]
- 22.Chen JY, Tong YH, Chen HY, Yang YB, Deng XY, Shao GL. A noninvasive nomogram model based on CT features to predict DNA mismatch repair deficiency in gastric cancer. Front Oncol. 2023;13:1066352. [DOI] [PMC free article] [PubMed] [Google Scholar]
- 23.Zhao H, Gao J, Bai B, Wang R, Yu J, Lu H, et al. Development and external validation of a non-invasive imaging biomarker to estimate the microsatellite instability status of gastric cancer and its prognostic value: The combination of clinical and quantitative CT-imaging features. Eur J Radiol. 2023;162:110719. [DOI] [PubMed] [Google Scholar]
- 24.Ooki A, Osumi H, Yoshino K, Yamaguchi K. Potent therapeutic strategy in gastric cancer with microsatellite instability-high and/or deficient mismatch repair. Gastric Cancer. 2024;27(5):907–31. [DOI] [PMC free article] [PubMed] [Google Scholar]
- 25.Qorib M, Oladunni T, Denis M, Ososanya E, Cotae P. Covid-19 vaccine hesitancy: Text mining, sentiment analysis and machine learning on COVID-19 vaccination Twitter dataset. Expert Syst Appl. 2023;212:118715. [DOI] [PMC free article] [PubMed] [Google Scholar]
- 26.Li X, Wang H, Gu B, Ling C. The convergence of linear classifiers on large sparse data. Neurocomputing(Amst). 2018;273:622–33. [Google Scholar]
- 27.Lin A, Zhang J, Luo P. Crosstalk Between the MSI Status and Tumor Microenvironment in Colorectal Cancer. Front Immunol. 2020;11:2039. [DOI] [PMC free article] [PubMed] [Google Scholar]
- 28.Yang Z, Dong H, Fu C, Zhang Z, Hong Y, Shan K, et al. A nomogram based on CT intratumoral and peritumoral radiomics features preoperatively predicts poorly differentiated invasive pulmonary adenocarcinoma manifesting as subsolid or solid lesions: a double-center study. Front Oncol. 2024;14:1289555. [DOI] [PMC free article] [PubMed] [Google Scholar]
- 29.Yang Y, Chen H, Ji M, Wu J, Chen X, Liu F, et al. A new radiomics approach combining the tumor and peri-tumor regions to predict lymph node metastasis and prognosis in gastric cancer. Gastroenterol Rep (Oxf). 2023;7:goac080. [DOI] [PMC free article] [PubMed]
- 30.Zeng Q, Zhu Y, Li L, Feng Z, Shu X, Wu A, et al. CT-based radiomic nomogram for preoperative prediction of DNA mismatch repair deficiency in gastric cancer. Front Oncol. 2022;12:883109. [DOI] [PMC free article] [PubMed] [Google Scholar]
- 31.Pepe MS, Kerr KF, Longton G, Wang Z. Testing for improvement in prediction model performance. Stat Med. 2013;32(9):1467–82. [DOI] [PMC free article] [PubMed] [Google Scholar]
- 32.Vickers AJ, Cronin AM, Begg CB. One statistical test is sufficient for assessing new predictive markers. BMC Med Res Methodol. 2011;11:13. [DOI] [PMC free article] [PubMed] [Google Scholar]
- 33.Tong Y, Li J, Chen J, Hu C, Xu Z, Duan S, et al. A Radiomics Nomogram Integrated With Clinic-Radiological Features for Preoperative Prediction of DNA Mismatch Repair Deficiency in Gastric Adenocarcinoma. Front Oncol. 2022;12:865548. [DOI] [PMC free article] [PubMed] [Google Scholar]
- 34.Lambin P, Leijenaar RTH, Deist TM, Peerlings J, de Jong EEC, van Timmeren J, et al. Radiomics: the bridge between medical imaging and personalized medicine. Nat Rev Clin Oncol. 2017;14(12):749–57. [DOI] [PubMed] [Google Scholar]
Associated Data
This section collects any data citations, data availability statements, or supplementary materials included in this article.
Supplementary Materials
Data Availability Statement
The datasets used during the current study are available from the corresponding author on reasonable request.