
Figure 1.
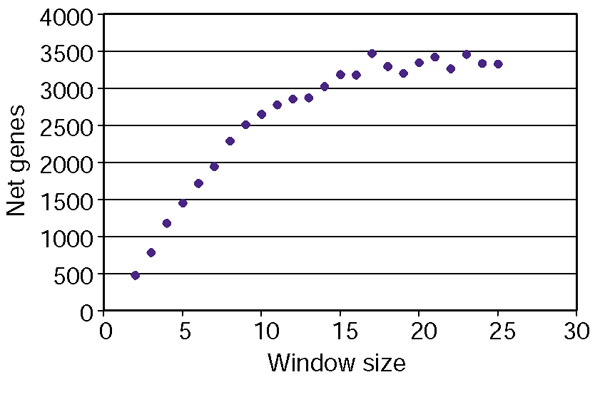
The number of genes identified as being in groups when different window sizes are used. In order to identify groups of adjacent, similarly expressed genes, the average pair-wise correlation of gene expression was calculated for genes in a sliding window across the genome, and this process was repeated for windows of different sizes. The net number of genes (that is, the number of genes in groups in the ordered dataset minus the number of genes in groups from the random dataset) is plotted against window size.