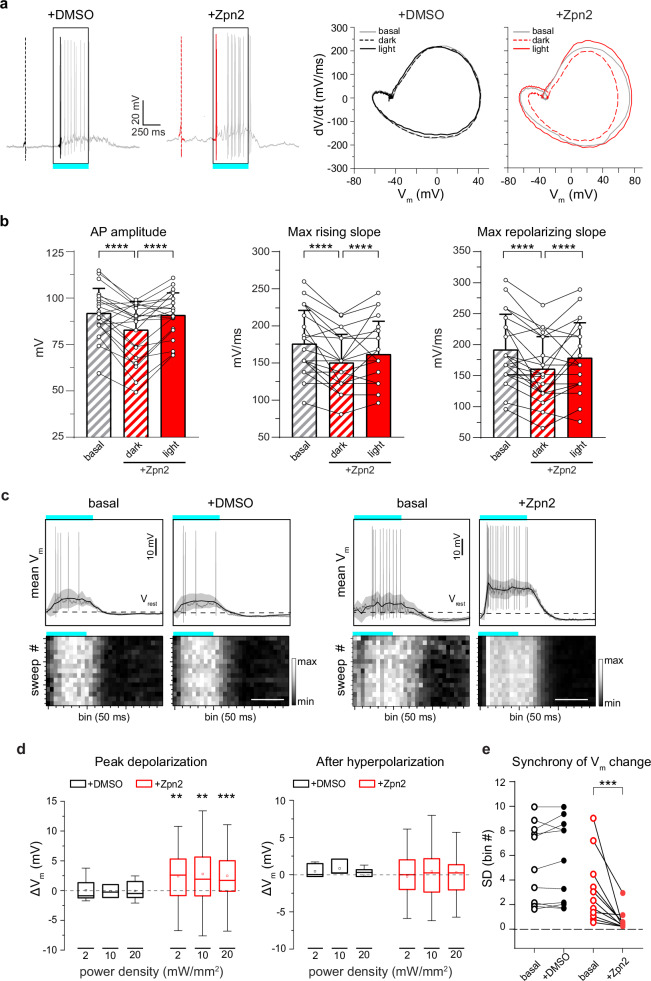
Fig. 2. The light-evoked capacitance change by Ziapin2 induces faster AP dynamics and membrane depolarization in the WT retina.
a Left: Representative whole-cell current-clamp traces recorded in two RGCs in the presence of either vehicle (10% v/v DMSO; left, black) or Ziapin2 (200 µM; right, red) showing the first spike in the dark (dashed line) and the first light-evoked spike (solid line). Right: Phase-plane plot analysis of the waveform of the first APs in the dark (dashed lines) and during cyan light stimulation (solid line; 20 mW/mm2, 500 ms) after puff application of either DMSO (black) or Ziapin2 (red), compared to the AP waveform in the dark under basal conditions (gray lines). b Changes in AP amplitude (left), maximal rising slope (middle), and maximal repolarizing slope (right) deduced from the phase-plane plot analysis of each recorded RGC before (basal) and after Ziapin2 application in the dark and under cyan light stimulation. Bars represent means ± SEM with superimposed individual points (n = 22 RGCs). c Top: Representative lowpass-filtered voltage traces recorded from RGCs before (basal) and after treatment with either vehicle (10% v/v DMSO; left), or Ziapin2 (200 µM; right) in a time window of 1.5 s, starting from the onset of the light stimulation (500 ms, cyan horizontal bar). The plots display the mean (± SD, gray area) Vm calculated within the same time window over 15 sweeps. Vrest (dashed line), membrane potential in the dark. APs are superimposed on the voltage traces. Bottom: Grayscale representation of Vm changes during the 15 sweeps (50-ms bins). Scale bars, 500 ms. d Box plots of peak depolarization (left) and peak after-hyperpolarization (right) calculated as the difference with respect to Vrest (see c) in RGCs treated with either vehicle (10% v/v DMSO; black) or Ziapin2 (200 µM; red) and stimulated with cyan light at increasing power densities (2, 10, and 20 mW/mm2; n = 12 and 34 for DMSO and Ziapin2 puffs, respectively). The box plot center line represents the mean, the square in the box is the median, box boundaries show the first and third quartiles, and whiskers display the minimum and maximum values. e Evaluation of the synchrony of voltage changes in response to cyan light before (basal) and after Ziapin2 or DMSO puff application (n = 10 and 11 RGCs for DMSO and Ziapin2 puffs, respectively). **p < 0.01, ***p < 0.001, ****p < 0.0001; two-tailed paired Wilcoxon’s signed-rank versus basal. Exact p-values and source data are provided as a Source Data file.

