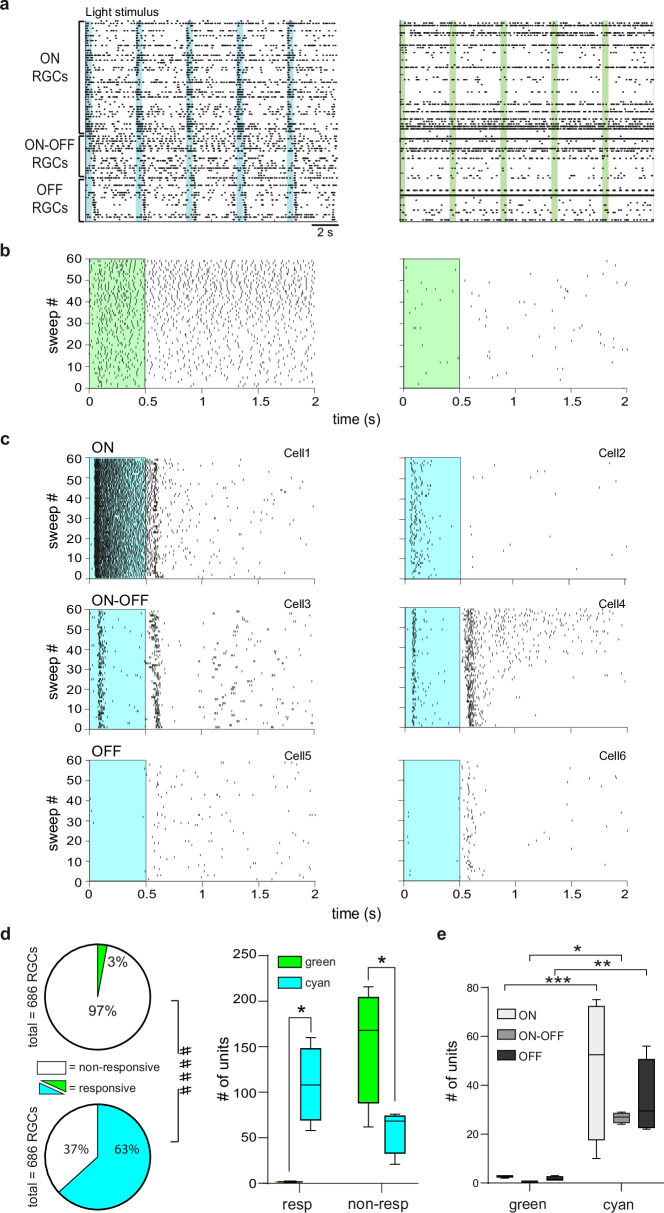
Fig. 4. Ziapin2 restores the ability of degenerate rd10 retinas to analyze visual information in segregated channels.
a Representative AP raster plots obtained from HD-MEA recordings of the same rd10 blind retinal explant after incubation with Ziapin2 (10 µM) stimulated with either cyan (left) or green (right) light (500 ms; 2 mW/mm2). Each row represents the firing activity of single RGCs that were sorted for polarity. Light-dependent firing activity was only restored with full-field cyan, but not green, light stimulation. Light pulses are indicated with vertical color-coded bars. b Representative raster plots of APs generated by two RGCs with very different spontaneous activity over 60 sweeps. In both cells, green light stimulation (green rectangle) could not modulate firing activity. c Representative raster plots of AP firing of different classes of RGCs in response to full-field stimulation with cyan light (cyan rectangle). Cyan stimuli evoked ON-sustained (Cell1), ON transient (Cell2), ON-OFF (Cell3, Cell4), OFF-suppressed (Cell5) and OFF-transient (Cell6) responses. d Left: Pie charts represent the percentage of RGCs responsive to light stimulation with green (top) and cyan (bottom) light with respect to the total number of RGCs recorded by HD-MEA (numbers reported in parenthesis). ***p < 0.001, two-sided Fisher’s exact test; responsive/non-responsive RGCs to green versus cyan light. Right: Box plots showing the number of responsive and non-responsive RGCs to either cyan or green light stimuli in the retinas from n = 4 rd10 mice. The box plot center line represents the mean, the square in the box is the median, the box boundaries are the first and third quartile, and the whiskers are the minimum and maximum of data. e Box plots showing the number of ON, ON-OFF, and OFF RGCs responsive to either cyan or green light stimuli in the retinas from n = 4 rd10 mice. The box plot center line represents the mean, the square in the box is the median, the box boundaries are the first and third quartile, and the whiskers are the minimum and maximum of data. ####p < 0.0001, Fisher’s exact test; responsive/non-responsive RGCs to green versus cyan light; *p < 0.05, **p < 0.01, ***p < 0.001, two-way ANOVA/Holm–Šídák tests (n = 4). Exact p-values and source data are provided as a Source Data file.

