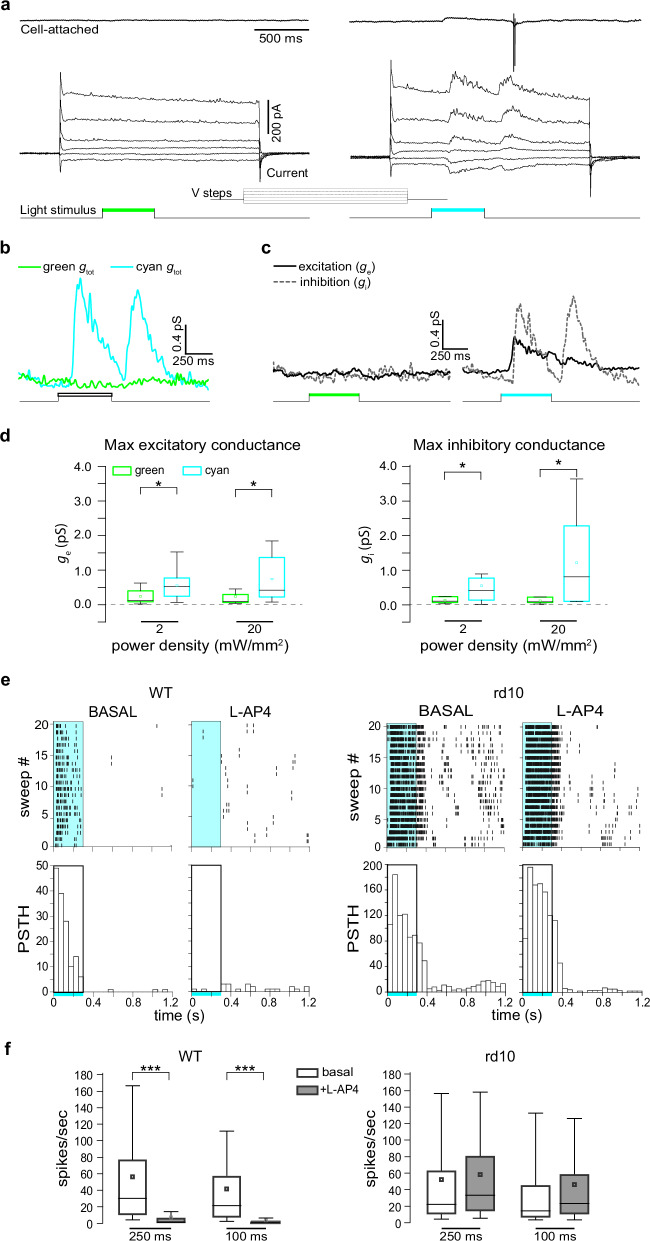
Fig. 6. Ziapin2 restores the light-evoked excitatory and inhibitory synaptic inputs to RGCs in degenerate rd10 retinas.
a Top: Representative voltage-clamp recordings in the cell-attached configuration of an OFF-RGC from a blind rd10 retina after 30 min incubation with Ziapin2 (10 µM) and subjected to full-field stimulation with either green (left) or cyan (right) light (500 ms, 20 mW/mm2). Bottom: Light-induced currents were recorded in the same RGC after reaching the whole-cell configuration and applying voltage steps from −86 to 34 mV. The light stimuli are shown as color-coded bars in the bottom traces. b Total conductances in the same Ziapin2-incubated RGC shown in (a) in response to either green or cyan light stimulation calculated from the current traces. c The excitatory (ge) and inhibitory (gi) conductances evoked, in the same RGC shown in (a), by either green (left) or cyan (right) light stimuli were extrapolated from the voltage-clamp recordings. d Box plots of the maximum values of excitatory (ge; left) and inhibitory (gi; right) conductances calculated from all RGCs stimulated with green (green boxes) and cyan (cyan boxes) light at 2 and 20 mW/mm2 power densities (n = 12 RGCs). *p < 0.05; 2-tailed paired Wilcoxon’s signed-rank test, cyan- versus green-light stimulation. e Left: Representative HD-MEA recordings (raster plots of 20 sweeps and respective PSTHs shown below) of an ON-RGC from a healthy WT retina stimulated with cyan light (2 mW/mm2; 250 ms; rectangle) under basal conditions and after the application of the mGluR6 agonist L-AP4, which abolishes the light-evoked activation of rod and cone-ON BCs. Right: The same protocol was applied to a representative RGC from blind rd10 retinas incubated with Ziapin2 (10 µM) and stimulated with cyan light before (basal) and after the application of L-AP4. f Box plots of the RGC firing activity in healthy WT retinas (left) and Ziapin2-treated blind rd10 retinas (right) stimulated with cyan light (2 mW/mm2) for 100 and 250 ms in the absence or presence of L-AP4 (n = 322 and 266 RGCs for WT and rd10 retinas, respectively from n = 2 WT and n = 2 rd10 mice). The box plot center line represents the mean, the square in the box is the median, box boundaries show the first and third quartiles, and whiskers display the minimum and maximum values. ***p < 0.001, two-tailed paired Wilcoxon’s signed-rank test, basal versus L-AP4. Exact p-values and source data are provided as a Source Data file.

