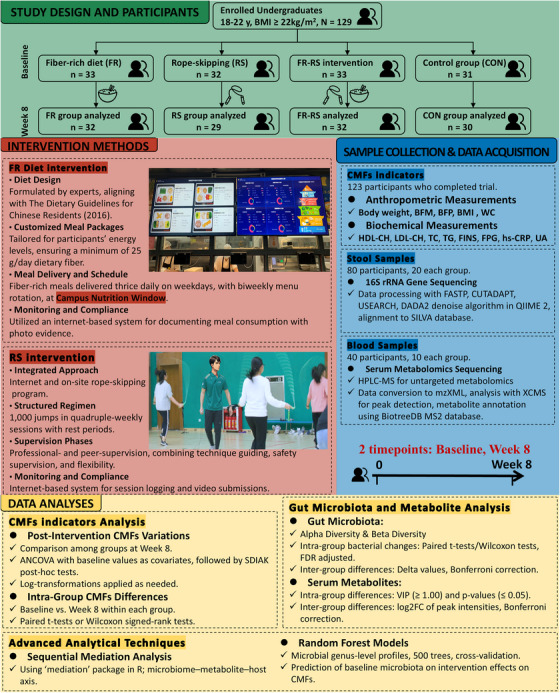
FIGURE 1.

Study design. ANCOVA, analysis of covariance; BFM, body fat mass; BMI, body mass index; BFP, body fat percentage; CMFs, cardiometabolic factors; CON, control group; FR, fiber‐rich diet group; FR–RS, fiber‐rich diet and rope‐skipping group; FINS, fasting insulin; FPG, fasting plasma glucose; HDL‐C, high‐density lipoprotein cholesterol; hs‐CRP, high‐sensitivity C‐reactive protein; LDL‐C, low‐density lipoprotein cholesterol; Log2FC, the log2 transformed fold changes of the peak intensity of individual metabolites of 8‐week/baseline; RS, rope‐skipping group; TC, total cholesterol; TG, triglyceride; UA, uric acid; WC, waist circumference.
