

Abstract
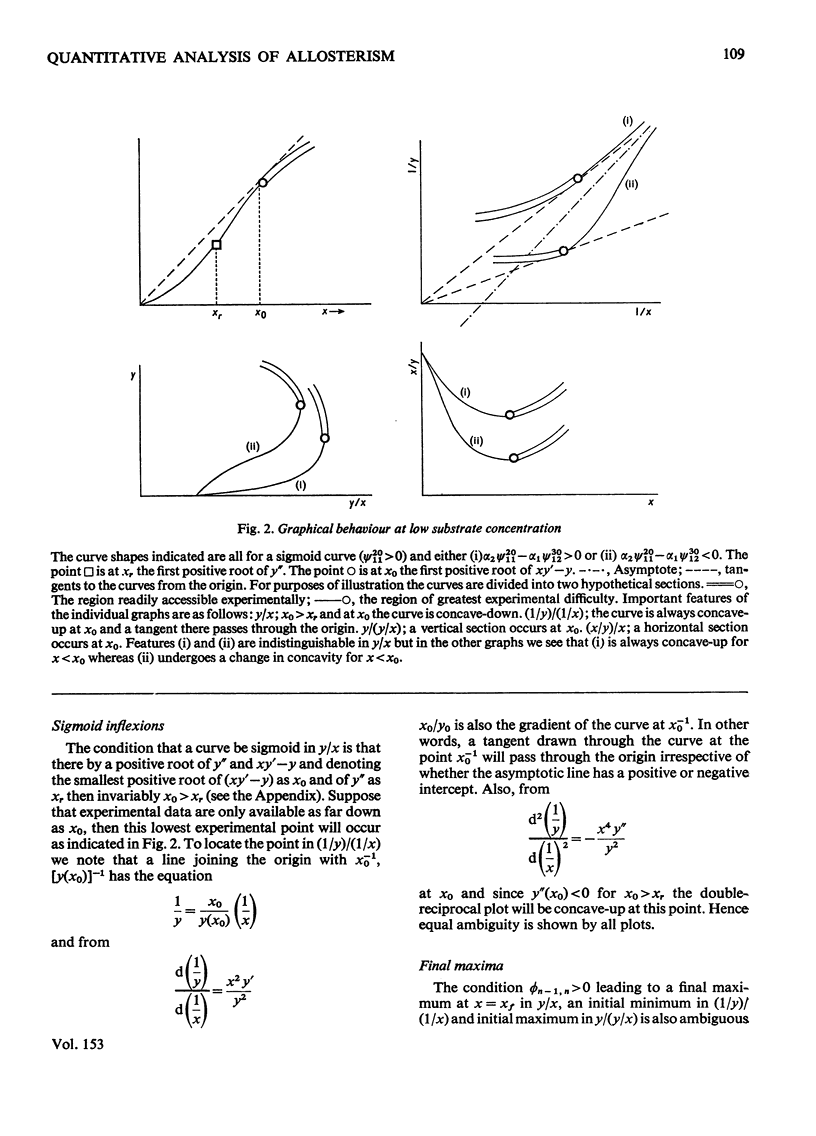
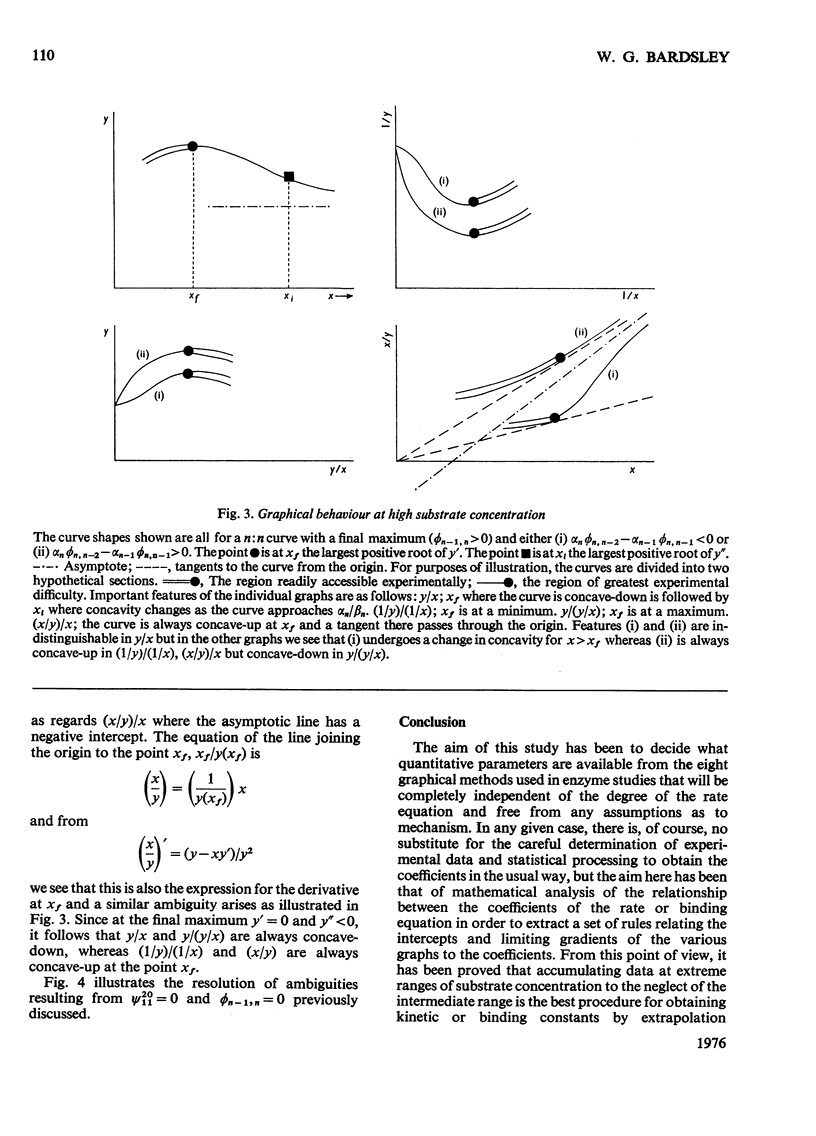
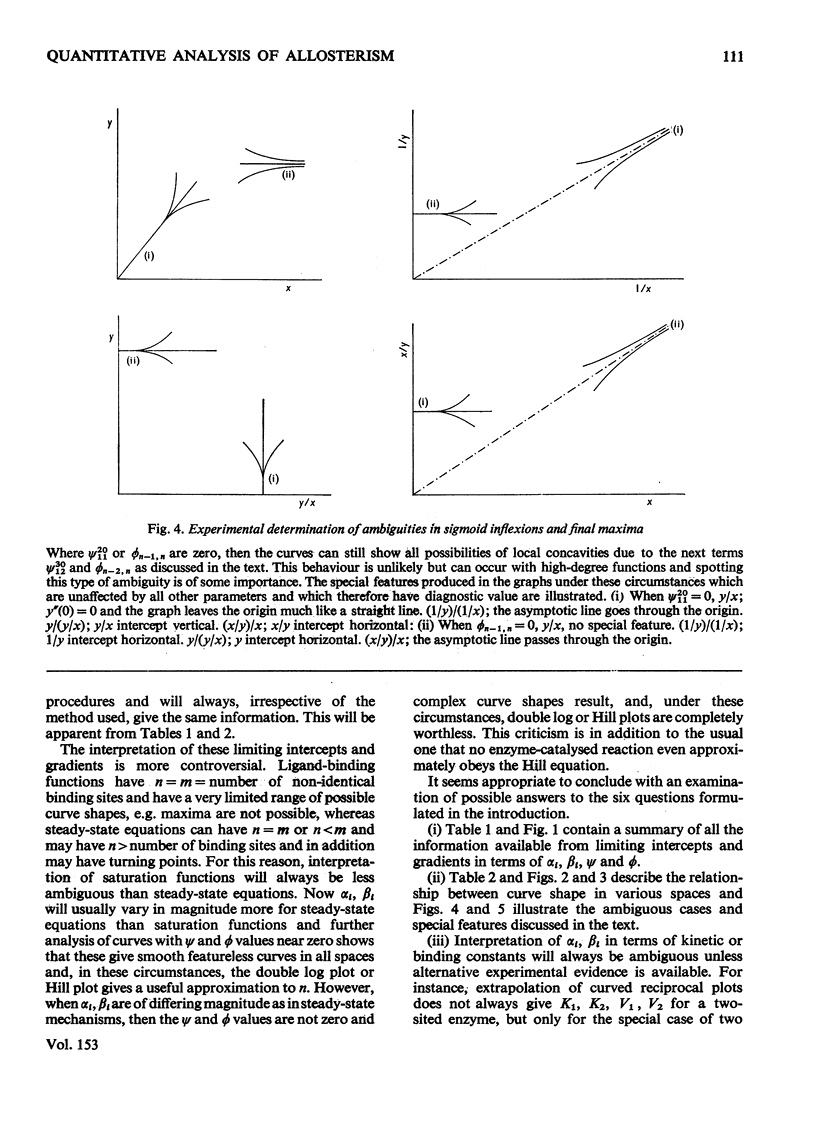
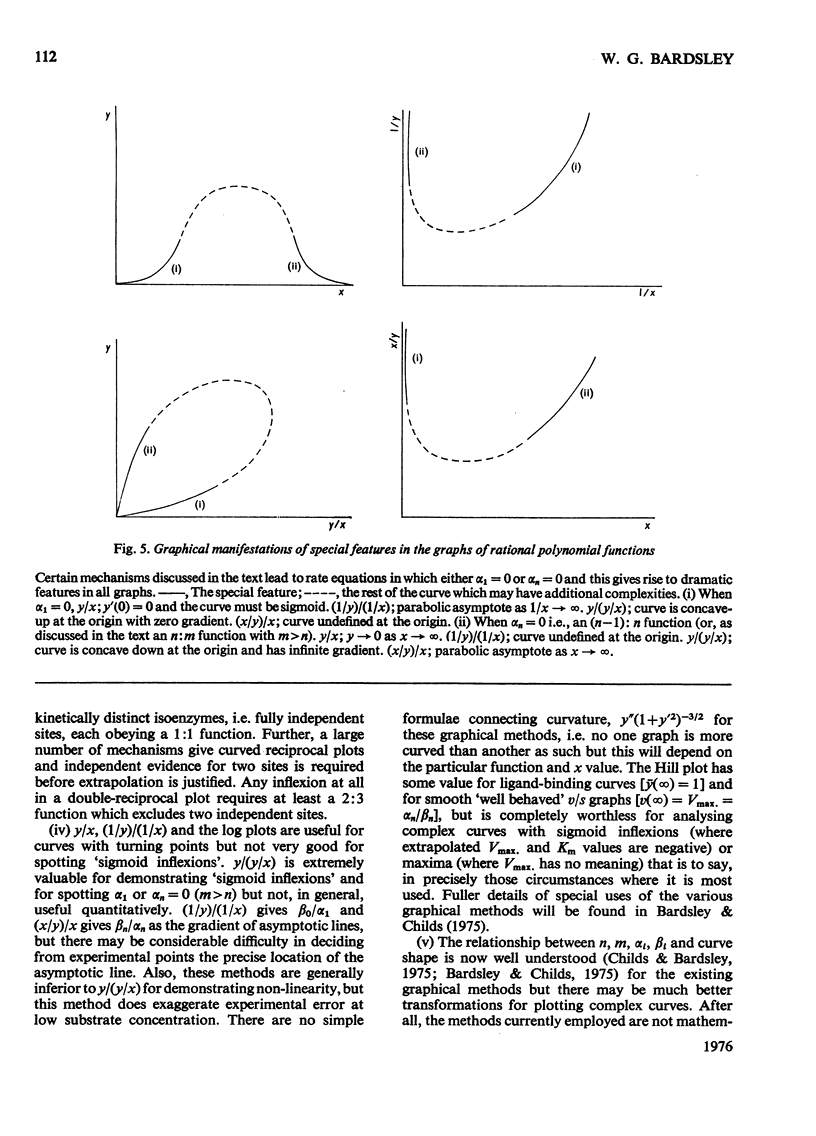
1. The eight methods for plotting enzyme kinetic data are classified and analysed, and it is shown how, in each case, it is only possible to obtain quantitative data on the coefficients of the lowest- and highest-degree terms in the rate equation. 2. The combinations of coefficients that are accessible experimentally from limiting slopes and intercepts at both low and high substrate concentration are stated for all the graphical methods and the precise effects of these on curve shape in different spaces is discussed. 3. Ambiguities arising in the analysis of complex curves and certain special features are also investigated. 4. Four special ordering functions are defined and investigated and it is shown how knowledge of these allows a complete description of all possible complex curve shapes.
Full text
PDF
Selected References
These references are in PubMed. This may not be the complete list of references from this article.
- Bardsley W. G., Childs R. E. Sigmoid curves, non-linear double-reciprocal plots and allosterism. Biochem J. 1975 Aug;149(2):313–328. doi: 10.1042/bj1490313. [DOI] [PMC free article] [PubMed] [Google Scholar]
- Bardsley W. G., Childs R. E. Sigmoid curves, non-linear double-reciprocal plots and allosterism. Biochem J. 1975 Aug;149(2):313–328. doi: 10.1042/bj1490313. [DOI] [PMC free article] [PubMed] [Google Scholar]
- Childs R. E., Bardsley W. G. Allosteric and related phenomena: an analysis of sigmoid and non-hyperbolic functions. J Theor Biol. 1975 Mar;50(1):45–58. doi: 10.1016/0022-5193(75)90023-5. [DOI] [PubMed] [Google Scholar]