
Figure 4.
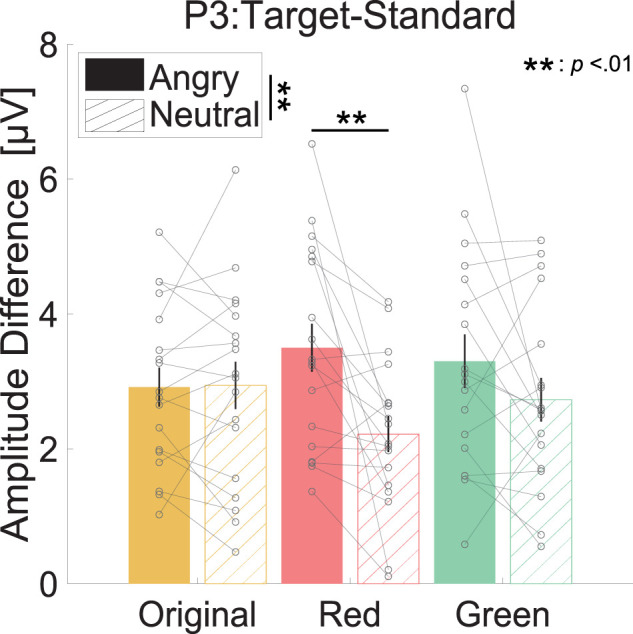
Mean of the difference in P3 amplitude [μV] for target and standard stimuli. Each gray point represents individual data. The color of each bar and the label on the horizontal axis indicate facial conditions. The filled and hatched bars indicate that target stimuli were angry faces and neutral faces, respectively. Error bars show the standard error of the mean.