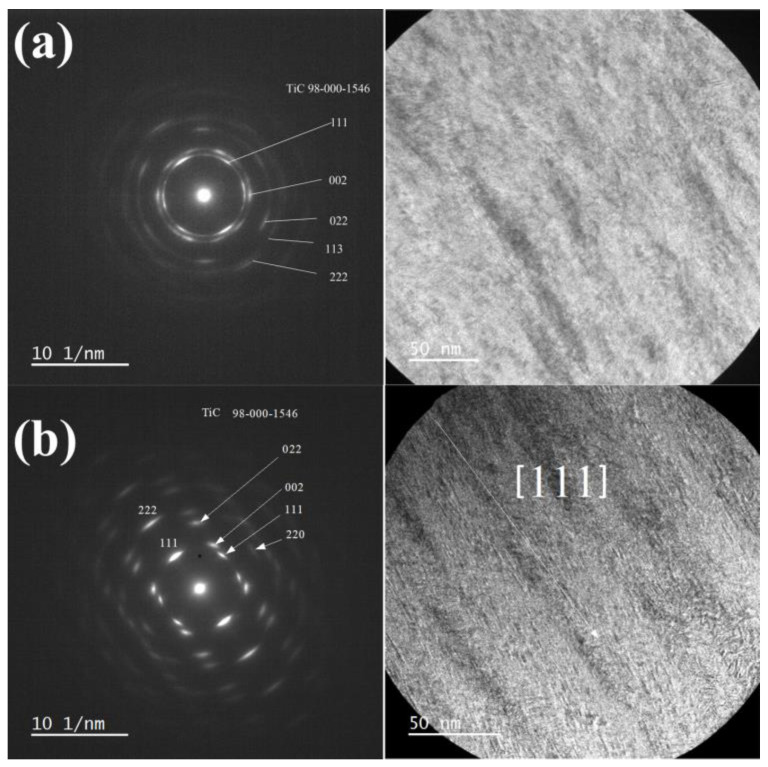
Figure 5.
Transmission electron microscopy characterization of TiZrMoC S3, recorded from the area: (a) close to the substrate; (b) close to the surface. Left image: selected area diffraction and identification of diffraction rings attributed to a crystalline structure with fcc; Right image: symmetryTEM image of the coating cross-section. Please note that diffraction is non-uniform, indicating preferential growth.

