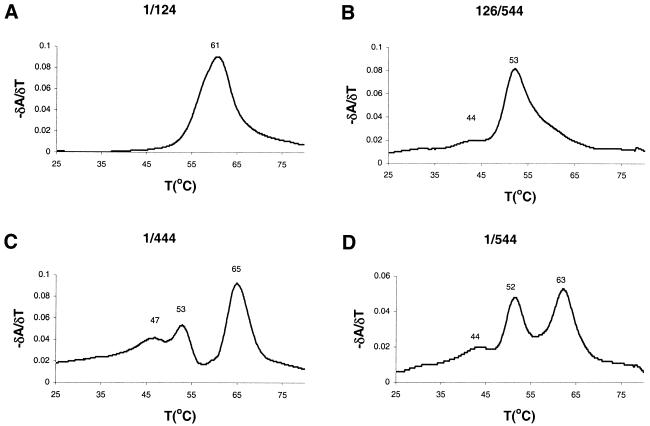
Figure 7.
Thermal melting profiles of HIV-2 leader RNAs. Melting was monitored by UV absorption at 260 nm. The curves show the first order derivative (δA/δT) to highlight the melting transitions. We analyzed transcripts 1/124 (A), 126/544 (B), 1/444 (C) and 1/544 (D). The melting temperature Tm is indicated at the top of the peaks.

