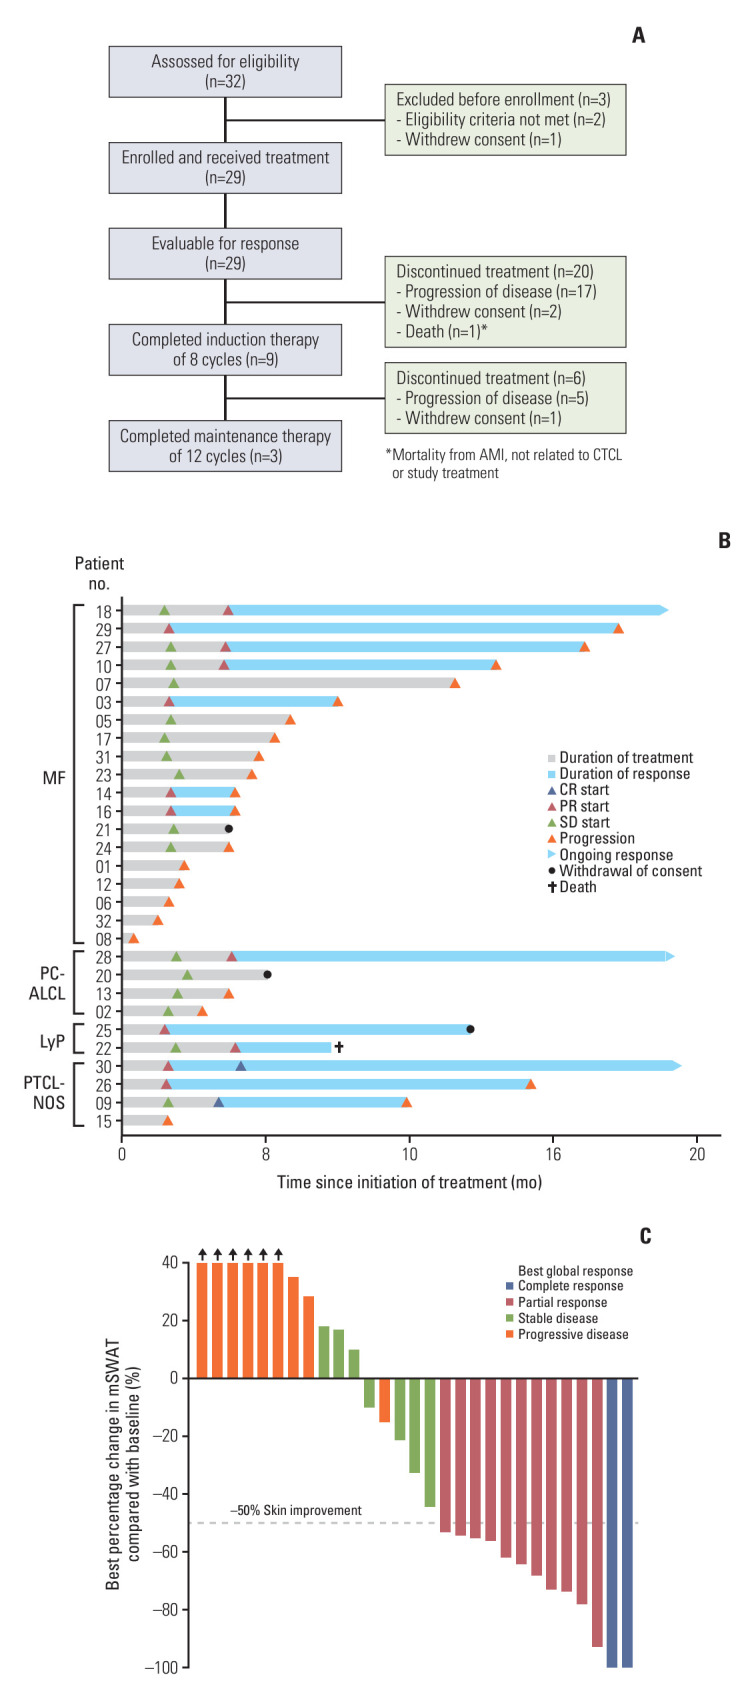
Fig. 1.

CONSORT diagram and pattern of tumor response. (A) Flowchart of participants in the BIC study. (B) Swimmer plot showing duration of the study treatment and tumor responses. (C) Best change from baseline in skin by mSWAT scoring system. Bar color reflects global response according to global response criteria. AMI, acute myocardial infarction; CR, complete response; CTCL, cutaneous T-cell lymphoma; LyP, lymphomatoid papulosis; MF, mycosis fungoides; mSWAT, modified Severity-Weighted Assessment Tool; PC-ALCL, primary cutaneous anaplastic large cell lymphoma; PR, partial response; PTCL-NOS, peripheral T-cell lymphoma, unspecified; SD, stable disease.
