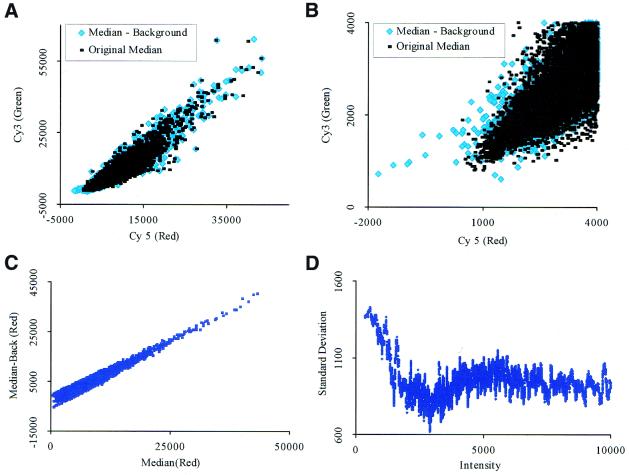
Figure 5.
Mean and median signals with background correction. (A) A graph of both the original median signal and the median signal with background subtraction. (B) An enlargement of the signals at lower intensities with background subtraction. Notice the wider error envelope. (C) The GenePix background correction profile. (D) The background correction standard deviation has a stronger effect for lower signal intensities. This effect decreases as the signal intensities increase.

