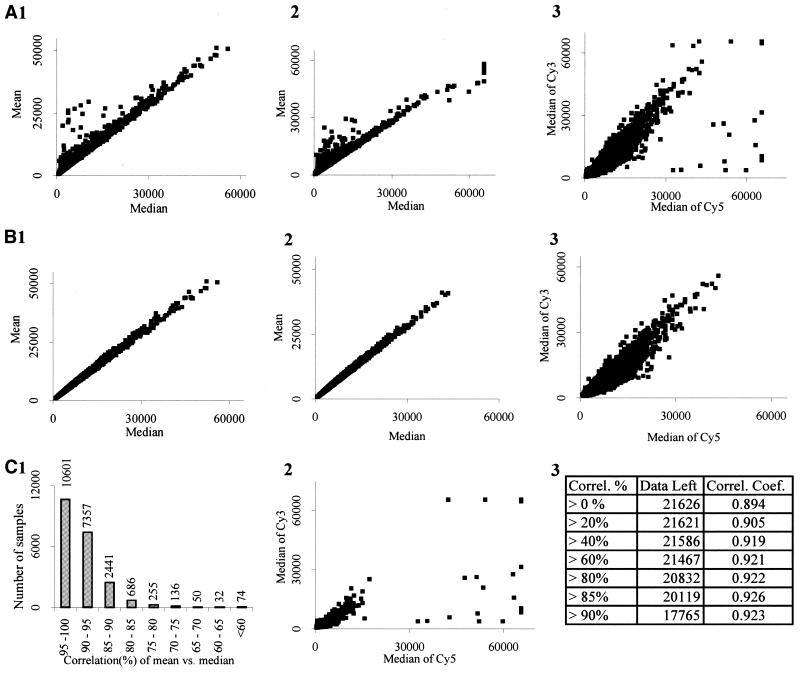
Figure 6.
The mean and median correlation. (A) A graph of the unfiltered mean and median signals for the Cy3 channel (1) and the Cy5 channel (2). (3) The original unfiltered data set. Graphs of the data from (A) with a 90% correlation elimination are shown in [B(1–3)]. Compare the original unfiltered signal in [A(3)] with the filtered signal in [B(3)]. [C(1)] A histogram representing the number of spots present in 5% increments of correlation values. (2) At a mean and median correlation of 85%, most of the outlying and deviating spots are eliminated (these spots are shown on graph). (3) The percentage of data that is retained after each successive correlation elimination and the corresponding correlation coefficient. For example, at a correlation/similarity of >85%, 20 119 of 21 626 data points are retained with a correlation coefficient of 0.926.

