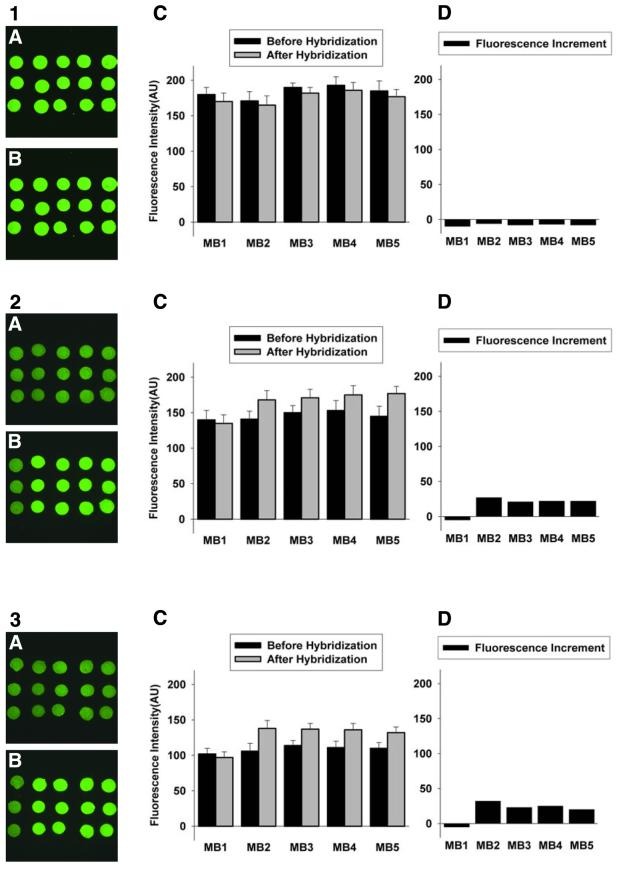
Figure 3.
Images and fluorescence intensities of the molecular beacon array on a glutaraldehyde-derived glass slide. The molecular beacons were spotted on the slides in triplet format. From left to right, the probes are MB1 (non-complementary to T2), MB2 (perfectly matched with T2) and MB3, MB4 and MB5 (one central base mismatch with T2). Hybridization buffer: 10 nM T2 in 20 mM Tris–HCl (pH 8.0) containing (1) 5, (2) 50 and (3) 500 mM MgCl2. Images of (A) and (B) are fluorescence images before and after hybridization, respectively. The plots of (C) and (D) are fluorescence intensity before and after hybridization and fluorescence intensity increment, respectively.

